Choose how to read this
🎧 Listen to this article — --:--
0:00 / --:--

Watch the explainer

The short film version of this story.

Play the audio and the sentence being read lights up. Tap any sentence to jump there.

Words you may not know, explained
deficit
The gap in one year when the government spends more than it takes in.
national debt
Every unpaid yearly gap stacked up — the total the government still owes.
Treasury bond
An IOU the U.S. government sells: you lend it money now, and it pays you back later with interest.
debt held by the public
The part of the debt owed to outside lenders — banks, funds, the Fed, foreign buyers — not the government owing itself.
intragovernmental debt
Money one part of the government owes another, mostly trust-fund IOUs such as Social Security’s.
interest
The rent on money already borrowed. It buys nothing new.
bond yield
The interest rate a lender demands to buy a government bond. When lenders worry, yields rise.
Federal Reserve
The U.S. central bank. It sets short-term rates and can buy or sell government bonds.
inflation
Prices rising across the economy, so each dollar buys less.
tariff
A tax on goods brought in from other countries, usually paid at the border by the importer.
IEEPA
International Emergency Economic Powers Act — a law presidents have used to justify emergency trade actions, including some tariffs.
Medicaid
The joint federal-state health program for people with low incomes.
SNAP
Supplemental Nutrition Assistance Program — food help, once called food stamps.
CHIP
Children’s Health Insurance Program — health coverage for kids whose families earn too much for Medicaid but still need help.
CBO
Congressional Budget Office — the nonpartisan scorekeeper for Congress on budget and economic effects.
CRFB
Committee for a Responsible Federal Budget — a nonprofit budget watchdog that backs neither party.
ITEP
Institute on Taxation and Economic Policy — a nonprofit that studies who pays what under tax changes.
GDP
Gross domestic product — the total value of what the country produces in a year.
trust fund
A government savings pile, often invested in Treasury IOUs. Social Security’s is the biggest.
debt ceiling
The legal cap on how much the Treasury may borrow. Hitting it without a raise risks a default.
roll call
The official public list of how each lawmaker voted on a bill.
buyback
When the Treasury buys back some of its own bonds early, usually to manage the debt mix.

Home › Explainers › National Debt · Undastandable Money Explained · September 2026

The United States owes more than $40 trillion. It crossed that line in August, and almost nobody running for office this fall wants to talk about it.

They should. This year the government is paying about as much in interestThe rent on money already borrowed. It buys nothing new. as the entire military budget costs, and that budget just reached about $1 trillion for the first time. In September, the people who lend America money started charging more for it, and that cost is already reaching mortgages and car loans.

Most debt coverage leaves out one thing. The debt did not just happen to us. Some of the borrowing paid for real emergencies that ended. The biggest piece that never ends was a choice: tax cuts made permanent, weighted toward the people who needed them least, and paid for with borrowed money. You are paying interest on it.


Contents

What's in the rest of this article?

  • The bill you already pay — interest, and how the bond market is now pushing it into your loans.
  • What the debt actually is — deficits, bonds, and who holds them.
  • The hidden tax nobody voted for — how a weaker dollar takes the most from people with the least.
  • How it got this big — twenty-five years, from nearly balanced to $40 trillion.
  • The cause built to never switch off — who got the tax cuts, and who paid for them.
  • 2026 on the credit card — a war, a promise, and tariffsA tax on goods brought in from other countries, usually paid at the border by the importer. the Supreme Court threw out.
  • The bond market's warning — what lenders are saying with their money.
  • The five ways out — and the catch in each one.
  • What you can do — names, votes, and a check you can run tonight.

Part 1 of 13

The bill you already pay

Interest is the rent on money already borrowed. It buys nothing new. No road, no school, no soldier.
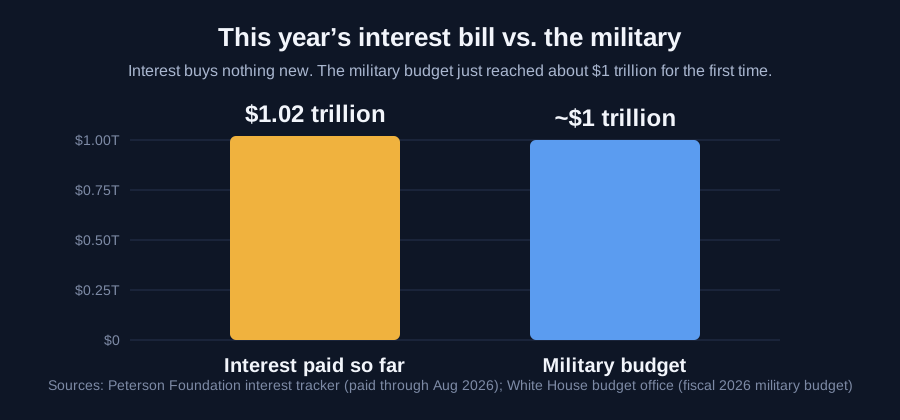
Bar chart of interest at 1.02 trillion dollars beside defense at about 885 billion
What to see: the interest bar is taller. Interest now costs more than the whole military.Chart from the article’s numbers. Sources: Peterson Foundation; CBO.

Through August, the government paid $1.02 trillion in interest this fiscal year, according to the Peterson Foundation's tracker. That is the first time the yearly bill has passed a trillion dollars. The White House budget office calls this year's military budget a historic $1 trillion, the first time it has reached that mark. So the interest bill is now about the same size as the whole military budget.

Think of it like a family that pays more on its credit cards each month than it spends on groceries. The groceries still need buying. So the family borrows more, and next month's card bill is bigger again.

The Committee for a Responsible Federal BudgetCommittee for a Responsible Federal Budget — a nonprofit budget watchdog that backs neither party., a group that tracks the budget and backs neither party, did the math per family. Interest on the debt works out to about $7,900 per household today. On the current path it reaches about $17,000 per household by 2036.

You do not get that bill in the mail. You pay it in three quieter ways. Part of your taxes goes to interest instead of services. Part of it shows up when programs you count on get squeezed to make room. And part of it now shows up in the rate on your next loan, which is where the story turned this month.

Justin Wolfers, an economist at the University of Michigan, warned in a MeidasTouch report in August that when the government borrows this much, interest rates can rise across the economy, making mortgages, car loans and credit card debt more expensive for everyday Americans.

That is no longer a warning about the future. By early September, MeidasTouch reported, the 10-year Treasury rate had climbed from under 4% to nearly 4.8% since the Iran war began, and mortgage rates were marching toward 7%. By September 28, the 10-year rate had closed at 5.24% and the 30-year at 5.56%, according to the Federal ReserveThe U.S. central bank. It sets short-term rates and can buy or sell government bonds.'s own daily table. On September 29 the 30-year closed at 5.59% by the Treasury's table, and CNBC reported it touched 5.61% during the day, its highest since June 2002.
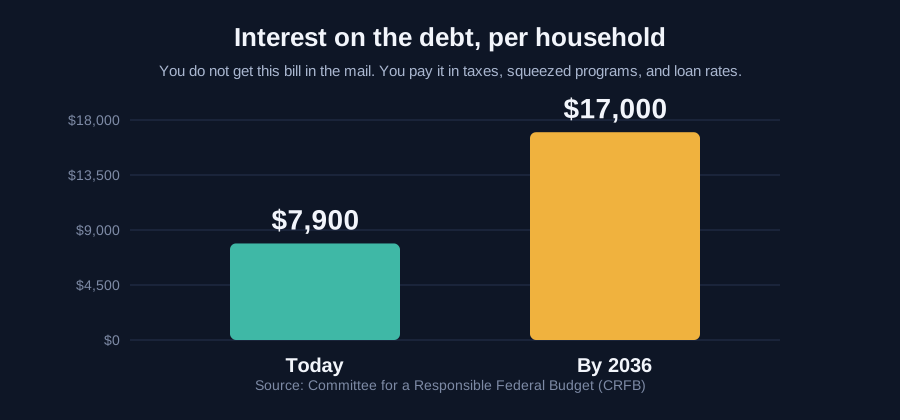
Bar chart of interest per household at 7900 dollars today and 17000 by 2036
What to see: the household interest bill more than doubles on the current path.Chart from the article’s numbers. Source: CRFB.

Part 2 of 13

What the national debt actually is

Picture a bathtub. Taxes pour in through the faucet. Spending drains out through the pipe: Social Security, Medicare, the military, interest and everything else. When more drains out than pours in, the gap is that year's deficitThe gap in one year when the government spends more than it takes in..

A bathtub with water pouring in from a faucet and draining out a pipe
What to see: taxes pour in, spending drains out. When more drains than pours, that year’s gap is the deficit. The debt is every unpaid gap stacked up.Illustration made for this page. No type on the picture.

The government fills the gap by borrowing. It sells IOUs called Treasury bondsAn IOU the U.S. government sells: you lend it money now, and it pays you back later with interest.. A bond is a promise: lend us $1,000 now and we will pay you back later, with interest along the way.

The national debtEvery unpaid yearly gap stacked up — the total the government still owes. is every one of those gaps, stacked up over decades and not yet paid back.

Treasury counts it to the penny every business day. On September 28, 2026, the total was $40,102,185,696,865.37. For the first eleven months of this fiscal year, the government took in about $4.8 trillion and spent about $6.8 trillion. That is a $2.0 trillion gap in under a year.

That $40 trillion total has two parts, and the difference matters.

About $7.7 trillion is the government owing itself. The biggest piece is the Social Security trust fundA government savings pile, often invested in Treasury IOUs. Social Security’s is the biggest.. For decades Social Security collected more than it paid out, and the law required it to lend the extra to the Treasury. Those IOUs are real, and the Treasury has to pay them back. Our Social Security explainer tells that story in full.

The other $32.4 trillion is owed to outside lenders: banks, pension funds, mutual funds, 401(k)s, insurance companies, the Federal Reserve, and foreign buyers. This is called debt held by the publicThe part of the debt owed to outside lenders — banks, funds, the Fed, foreign buyers — not the government owing itself.. Most economists treat it as the number that counts, because it is the part the government has to keep borrowing in the open market to roll over.

The whole economy produces about $32.6 trillion a year. So what America owes outside lenders is now about as big as everything the country makes in a year. The last time it was that high was the end of World War II.
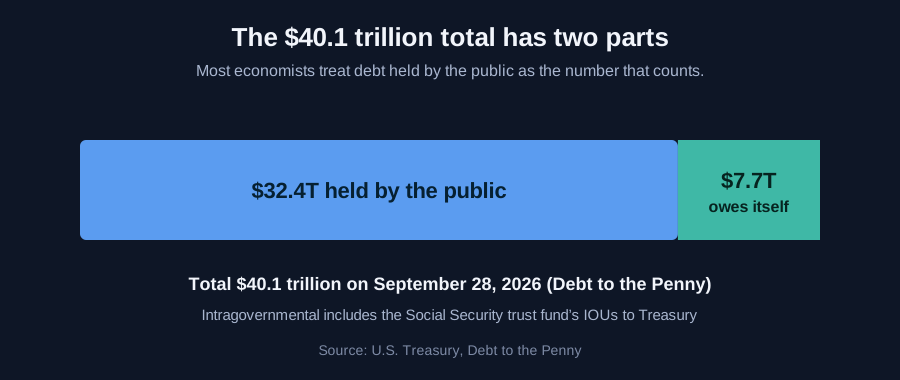
Stacked bar of 40.1 trillion dollars split into 32.4 trillion held by the public and 7.7 trillion the government owes itself
What to see: most of the pile is owed to outside lenders. The smaller slice is the government owing itself, including Social Security’s IOUs.Chart from the article’s numbers. Source: Treasury Debt to the Penny.

Part 3 of 13

Who we actually owe

You will hear that China owns America. It does not.
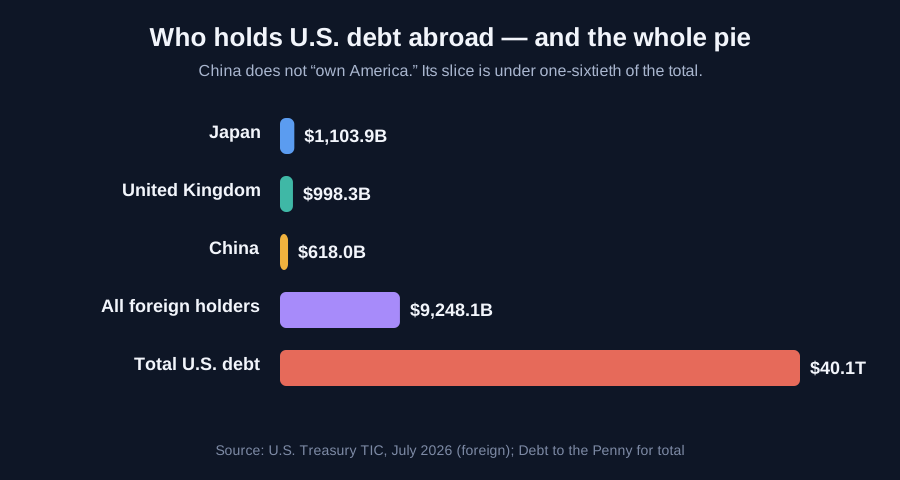
Horizontal bars for Japan, the UK, China, all foreign holders, and total U.S. debt
What to see: China is third among foreign holders and tiny next to the whole pile. Most debt is owed at home.Chart from the article’s numbers. Source: Treasury TIC, July 2026.

Foreign buyers hold about $9.25 trillion of U.S. debt, according to the Treasury's July count. Japan is the biggest foreign lender at about $1.10 trillion. The United Kingdom is next at about $1.00 trillion. China is third at about $618 billion, its lowest in years. China's slice is less than one-sixtieth of the total.

Most of the debt is owed to Americans. It sits in pension funds, bank accounts, retirement plans and the Social Security trust fund.

That sounds comforting until you swap in what it really means. "We owe it to ourselves" means the government owes it to your retirement money. It owes it to the pension fund that pays your parents. It owes it to the Social Security checks you have paid into with every paycheck.

So when someone says the debt can always be handled by printing money, ask who holds the dollars that would lose value. Much of the answer is ordinary people's savings.

The Social Security piece is coming due now. The trust fund is paying out more than it takes in, so it is cashing in its IOUs. To pay them, the Treasury borrows from the public, at today's higher rates. The 2026 Trustees Report says the retirement fund runs out in the last three months of 2032. After that, unless Congress acts, checks shrink to about 78 cents on the dollar.

That is why Social Security keeps showing up in every debt fight. It is one of the few big numbers Congress can shrink with one vote, and the people it would shrink are the people least able to fight back.


Part 4 of 13

Borrowing to pay interest on money we already borrowed

Picture a snake eating its own tail. That is the loop the budget is in now.
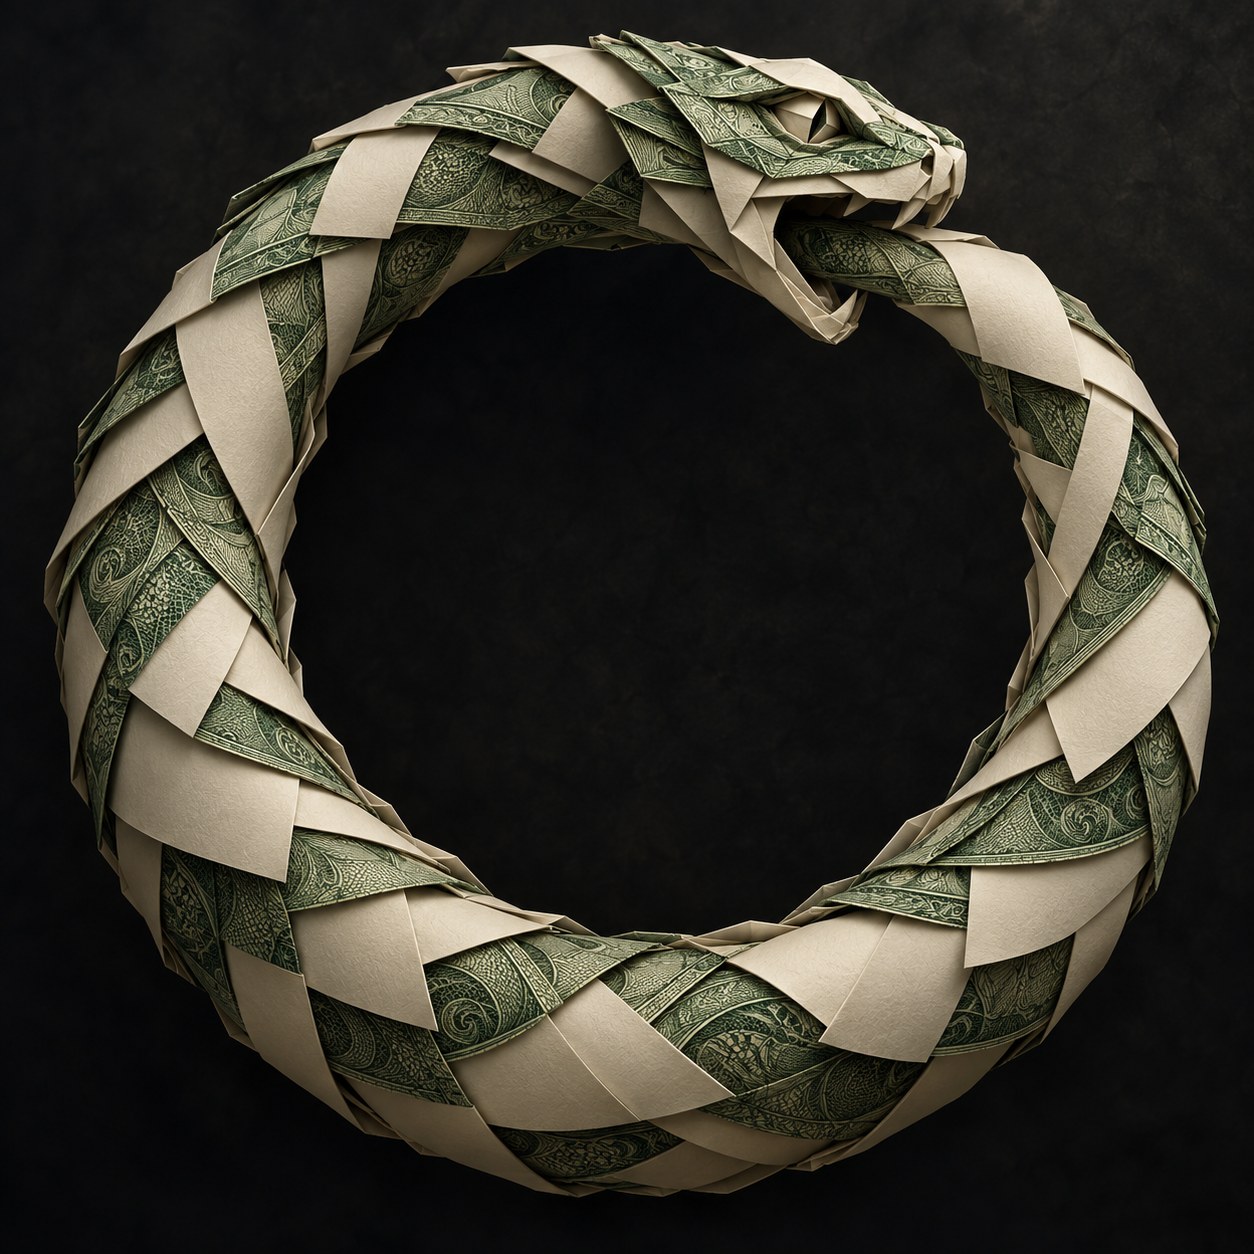
A snake made of dollar bills and IOU paper eating its own tail
What to see: the borrowing-to-pay-interest loop. New bonds pay interest on old bonds, and the loop tightens.Illustration made for this page. No type on the picture.

The government runs a $2 trillion gap. About half of that gap is interest. So the Treasury sells new bonds partly to pay interest on old bonds. The new bonds carry interest too. Next year's interest bill is bigger, so next year's borrowing is bigger.

In plain steps: borrow money, owe interest, borrow to pay the interest, owe more interest.

The Committee for a Responsible Federal Budget warned in May that, on its projection, the average interest rate the government pays would pass the economy's growth rate by 2029. Once that happens, the debt grows faster than the country's income even if Congress passes nothing new at all. The loop feeds itself.

The United States has one escape hatch you do not. It borrows in dollars, and the Federal Reserve can create dollars. When the Fed buys government bonds with newly created money, the Treasury has an extra buyer. That makes a Greece-style default, where a country simply cannot pay, very unlikely.

But making money is not free. If more dollars chase the same goods, each dollar buys less. The cost moves from the tax bill to the price tag. You pay at the store instead of on April 15.

Right now the Fed is doing the opposite. On September 16 it raised its key rate to between 3.75% and 4%, its first increase since 2023, because prices are rising too fast. Higher Fed rates fight inflationPrices rising across the economy, so each dollar buys less.. They also raise what the government pays on every short-term bond it sells. The loop gets tighter from both ends.


Part 5 of 13

The hidden tax nobody voted for

When borrowing and money creation make prices rise, it works like a tax. Nobody passes it. Nobody signs it. It just shows up at the register.

An ice cube melting on a kitchen counter next to a paycheck
What to see: inflation as a hidden tax. The paycheck looks the same while its buying power melts.Illustration made for this page. No type on the picture.

It does not hit everyone the same. If you own a house, stocks or a retirement account, rising prices can lift what you own. Your wealth has a shield.

If you live on a paycheck and keep your money in checking, you have no shield. Your dollars are like an ice cube left on the counter. They are still there, but every week there is less of them. And most of your paycheck goes to food, rent, gas and utilities, the things that rise fastest.

Economists at the Federal Reserve Bank of Minneapolis and at Stanford have found the same pattern: inflation takes a bigger bite from people with less. That makes it the opposite of a fair tax. It is closer to a sales tax on being broke.

Ray Dalio, who built the world's largest hedge fund, has been warning about this for years. Dalio said in January that his grandchildren and great-grandchildren, not yet born, will be paying off this debt in devalued dollars.

So the phrase fits. The debt works as a hidden tax nobody voted for.

But somebody did vote. Every dollar of this borrowing passed Congress in a recorded vote and was signed by a president. You chose those people. The tax is hidden, but the people who created it are not. Their names are on the roll calls, and later in this article you will see how to look them up.


Part 6 of 13

How it got this big

To see where a number this big came from, find the last time the books were close to even. Then count forward.
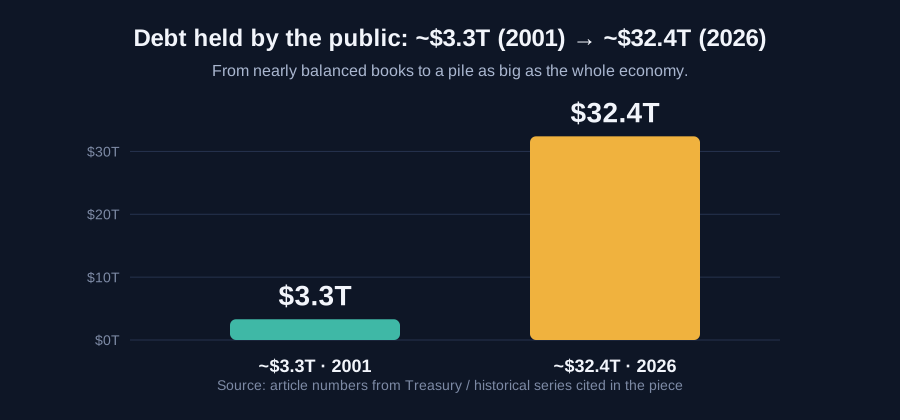
Bar chart of debt held by the public growing from about 3.3 trillion in 2001 to about 32.4 trillion in 2026
What to see: the public debt grew about tenfold in twenty-five years.Chart from the article’s numbers.

That moment was around 2001. The government had just run four straight surpluses, from 1998 through 2001. Debt owed to outside lenders had fallen to about $3.3 trillion, roughly a third of the economy. In January 2001 the Congressional Budget OfficeCongressional Budget Office — the nonpartisan scorekeeper for Congress on budget and economic effects. projected trillions more in surpluses over the next ten years.

Today that same debt is about $32.4 trillion. This is what filled the gap, in order.

Two wars on borrowed money. Brown University's Costs of War project puts the wars in Afghanistan, Pakistan, Iraq and Syria at about $4.4 trillion through 2022, and about $6.6 trillion once future care for veterans is counted. No tax was raised to pay for them.

Tax cuts in 2001 and 2003. They were written to expire. Most of them were later made permanent.

A drug benefit with no money behind it. The 2003 Medicare prescription benefit was sold to Congress at about $400 billion. Within months, the estimate became $534 billion. No new tax was created to pay for it.

The 2008 crash. Wall Street was allowed to take on more risk in the years before. Laws signed in 1999 and 2000, under a Democratic president, lowered the old walls between banks, brokers and insurers and kept many derivatives away from normal oversight. In 2004 the Securities and Exchange Commission let the brokerage arms of the five biggest investment banks apply to use their own math models to work out part of their safety cushions. By 2008 two of the five were gone. The rescue and the recession that followed produced the biggest deficits since World War II.

The pandemic. About $3.6 trillion in relief under President Trump and $2.1 trillion more under President Biden. Most of it passed with votes from both parties while the economy was shut down.

The 2017 tax cuts, and then the 2025 law that made them permanent.

And under all of it, interest, compounding the entire time.

Both parties are in that list. That part is true. But the list hides the most important difference between its items, and that difference is the next section.
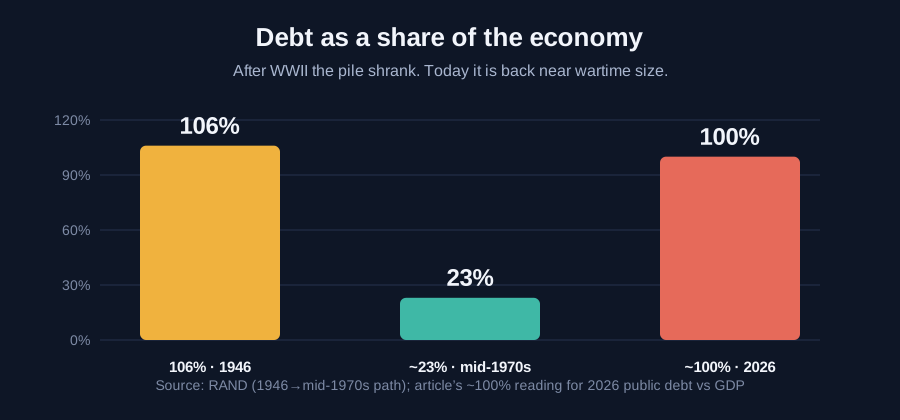
Bar chart of debt as a share of the economy: 106 percent in 1946, about 23 percent by the mid-1970s, about 100 percent in 2026
What to see: after WWII the pile shrank relative to the economy. Today it is back near wartime size.Chart from the article’s numbers. Source: RAND for the postwar path.

Part 7 of 13

The cause built to never switch off

Emergency spending has an off switch. The pandemic money was enormous, and almost all of it ended. The checks stopped. The programs closed. On a chart it looks like a spike that falls back down.
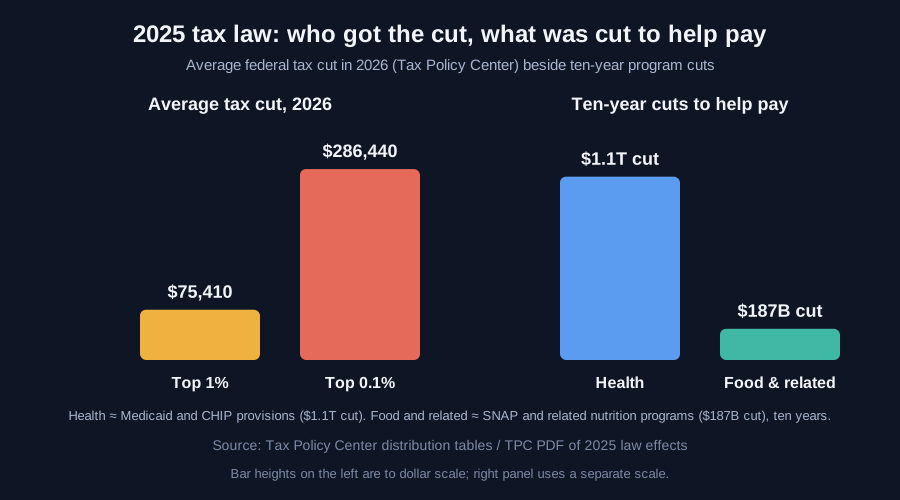
Bars for average 2026 tax cuts at the top 1 percent and top 0.1 percent beside ten-year health and food cuts
What to see: the biggest average cuts went to the top. Health and food programs were cut to help pay.Chart from the article’s numbers. Source: Tax Policy Center.

A permanent tax cut has no off switch. It takes revenue out of the Treasury every single year, forever, and the borrowing it causes piles up interest behind it.

The 2017 tax cuts were written with an off switch. Most of the cuts for individuals were set to expire at the end of 2025. In 2025, Congress and President Trump removed the switch. The law they passed, which supporters called the One Big Beautiful Bill, made the main 2017 cuts permanent. The Congressional Budget Office and the Joint Committee on Taxation put the whole law's addition to the deficit at about $4.1 trillion over ten years, counting the extra interest.

So who got the money?

The Institute on Taxation and Economic Policy found that more than 70% of the net tax cuts go to the richest fifth of Americans. Less than 1% goes to the poorest fifth. Jon Whiten, the group's deputy director, told CBS News in July that the top 1% are in line to get $1 trillion in tax cuts from the law over a decade.

And how was part of it paid for? The same law cut about $1.1 trillion from health care over ten years, most of it from MedicaidThe joint federal-state health program for people with low incomes., and about $187 billion from SNAPSupplemental Nutrition Assistance Program — food help, once called food stamps. and related nutrition programs. CBS reported in July that SNAP participation had already dropped by more than 4 million people. Medicaid enrollment is expected to fall by 5 million to 10 million people starting in 2027.

The Tax Policy Center ran the numbers for this year. The top 1% get an average tax cut of about $75,000. The top 0.1% get about $286,000 each. For the poorest fifth of households, the tax changes raise income by less than 1%, and that is before the Medicaid and food cuts land on the same families.

Put those side by side. Health care and groceries were cut at the bottom. Tax cuts were locked in at the top. The gap between the two was borrowed. That borrowed gap is part of the $40 trillion, and every taxpayer pays interest on it, including the families who lost coverage.

Even the corporate side shows it. Corporate income tax collections are down about $95 billion this fiscal year, a 24% drop, according to the American Action Forum.

Supporters say the cuts cost nothing, because they measure against a world where the cuts were always permanent. That is an accounting choice. The Treasury's bank account does not care which yardstick was used. The money that would have come back under the old law does not come back, and the hole is filled with borrowing.

Senator Patty Murray of Washington has called the Republican tax cuts the single biggest driver of the debt. Reason magazine, which quoted her, argues both parties share the blame. The numbers above point to the tax cuts as the one piece built to never end.


Part 8 of 13

2026 on the credit card

This year added three more entries to the tab.

A war with no way to pay for it. The Iran war had cost $43.6 billion as of this month, the Pentagon's own estimate, Roll Call reported on September 18. The Pentagon has asked Congress for $67.1 billion in extra money, partly to cover those costs. No tax was raised to pay for any of it. Like Iraq and Afghanistan, it goes straight onto the debt. It also pushed oil prices up, which pushed inflation up, which is part of why interest rates are rising.

Tariffs sold as the fix. The administration said tariffs would bring in enough money to shrink the deficit. On February 20, the Supreme Court ruled 6 to 3 that the emergency law used for most of those tariffs never gave the president that power. By late July the government had paid back about $100 billion, according to a court filing reported by NBC News and Reuters. By August the American Action Forum counted about $110 billion, and customs collections fell sharply from May through August.

The painful part: research from Germany's Kiel Institute, reported by The Wall Street Journal, found that foreign exporters absorbed only about 4% of the tariff cost. Americans paid the rest in higher prices. So shoppers paid the tariffs, and the refunds went to importers.

A promise nobody priced. President Trump has floated $5,000 checks. Mick Mulvaney, his own former chief of staff, said on Fox Business that the real cost would be around $1.3 trillion, and that it would add to the debt, drive up inflation and push interest rates higher.

Meanwhile the man in charge of the borrowing is calm. Treasury Secretary Scott Bessent told CNBC in August that there is nothing magic about the $40 trillion number, and that the country can grow its way out.

Growth does help. But growing your way out means the economy has to grow faster than the interest piles up. The Committee for a Responsible Federal Budget says that stops happening by 2029.

Bar chart of interest at 1.02 trillion dollars beside defense at about 885 billion
What to see: the interest bar is taller. Interest now costs more than the whole military.Chart from the article’s numbers. Sources: Peterson Foundation; CBO.

Part 9 of 13

The bond market's warning

The people who lend America money do not give speeches about it. They set a price. In September the price went up.
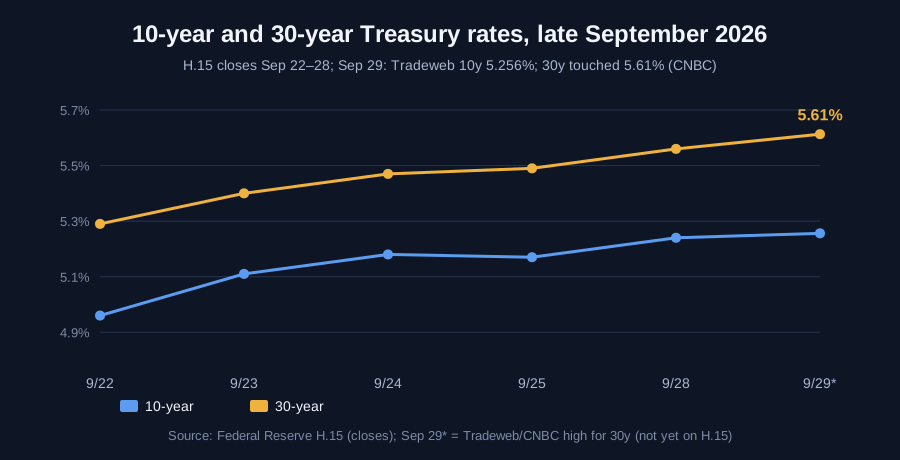
Line chart of 10-year and 30-year Treasury rates in late September 2026, with the 30-year touching 5.61 percent
What to see: both long rates climbed through the week. The 30-year’s 5.61% touch is the highest since 2002.Chart from VERIFY.md / Fed H.15 and CNBC for the Sep 29 high.

Long-term Treasury rates climbed to their highest levels in about two decades. MarketWatch, quoted by MeidasTouch on September 29, said the Treasury market was on the verge of one of its worst months in years. In August, a 30-year Treasury sale cleared at 5.216%, the highest for that kind of auction since 2001, and buyers were thinner than expected, according to the Committee for a Responsible Federal Budget. On September 29 the 30-year rate touched 5.61% during the day, CNBC reported, a level last seen in 2002.

The Treasury tried to calm things down. In August it announced it would double the size of some bond buybacksWhen the Treasury buys back some of its own bonds early, usually to manage the debt mix., and in September one buyback hit $6 billion, triple the usual, MeidasTouch reported. Rates kept rising anyway. Market analyst Charlie Bilello said Washington was considering using nearly $1 trillion of the Treasury's own cash to hold yields down, instead of cutting deficits.

Other forces are pushing rates up too: high oil prices from the war, stubborn inflation, and strong demand for money from companies building AI data centers. But put the pieces side by side. Record borrowing. More bonds to sell every month. An auction that drew weak demand. Buybacks that did not work. Warnings from the head of the biggest bank in the country. The evidence points one way: lenders want to be paid more to hold American debt, and the size of that debt is part of the reason.

The warnings are not coming from fringe voices. Jamie Dimon, who runs JPMorgan Chase, said in April that the way it is going now, there will be some kind of bond crisis. Jerome Powell, then chair of the Federal Reserve, said at Harvard in March that the level of the debt is not unsustainable, but the path is not sustainable, and that it will not end well if nothing is done fairly soon. The Congressional Budget Office's director, Phillip Swagel, wrote in February that its projections show a path that is not sustainable. Powell added that he was not predicting a market event any time soon. The warning is about the path, not about next week.

Moody's took away America's top credit rating in May 2025, the last of the big three agencies to do it.

That is the fear. The hope is real too.

After World War II, the debt stood at 106% of the economy. By the mid-1970s it was about 23%. Growth did most of the work, with steady budgets and some help from inflation. The dollar is still the world's main currency. Most of the debt is owed at home. A few rough years do not erase the faith people around the world have in this country. But faith is not free. The longer the loop runs, the more it costs to earn it back.


Part 10 of 13

The five ways out, and the catch in each

Any plan to fix the debt has to go through one or more of these doors.
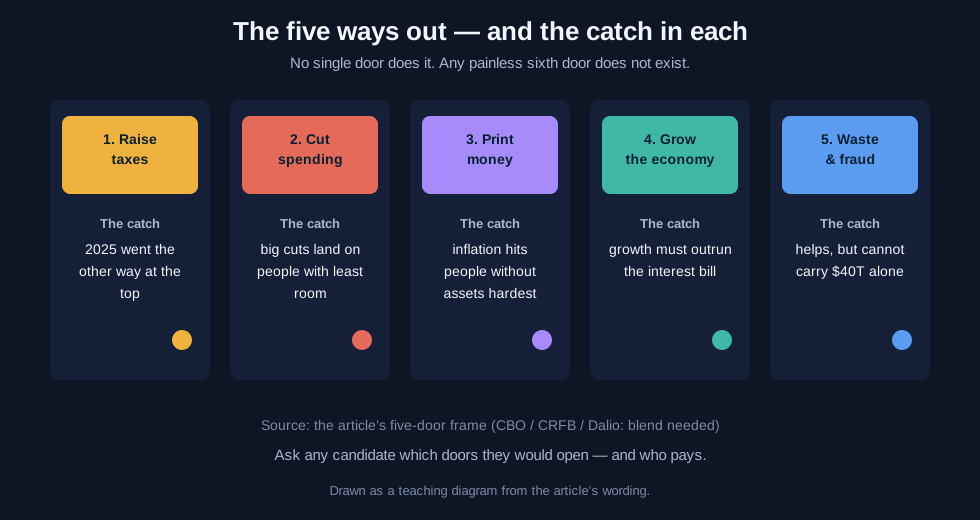
Five labeled doors for raising taxes, cutting spending, printing money, growing the economy, and tightening waste, each with its catch
What to see: five real doors, each with a catch. No painless sixth door exists.Teaching diagram drawn from the article’s five-door frame.
  1. Raise taxes. The 2025 law went the other way at the top. Reversing the top-end cuts is the most obvious place to start, because that is where the money went.
  1. Cut spending. Social Security, Medicare, Medicaid and interest already take up most of the budget. Even cutting everything else to zero would not close the gap. Cuts that land on health care and food fall on the people with the least room to absorb them.
  1. Print money. You pay through inflation, and the people without assets pay the most. Push it far enough and prices run away.
  1. Grow the economy. The healthiest door. But growth has to outrun the interest bill, and no one can order that into existence.
  1. Tighten real waste and fraud. Medicaid is health care for tens of millions of people. It is not waste. But any program that big has billing errors, improper payments and scams. The answer is to find the leaks and close them, not to gut the program because part of it leaks. This door helps. It cannot carry the load alone.

The budget watchdogs, the CBO and investors like Dalio land on the same math: no single door does it. Dalio has called for a little bit of everything: more revenue, less spending, done gradually. A bipartisan commission proposed that blend in 2010. Washington walked away from it.

Any candidate who promises a painless fix is selling a sixth door that does not exist. Ask which of the five they would open, and who pays for it.


Part 11 of 13

What you can actually do

That anger over borrowing to pay interest has somewhere to go. Seven things you can do, starting tonight:

A person at home connected by a thread to a politician in a legislature chamber
What to see: your vote is attached to their vote. The caption, not the picture, names the person “YOU.”Illustration made for this page. No type on the picture.
  1. Find your politicians and MAKE THEM ACCOUNTABLE. Not the famous ones on TV. Yours. Our Voter tool shows your House member, both senators and their records in one place.
  1. Pull the receipts. Every vote on the 2025 tax law and on the debt ceilingThe legal cap on how much the Treasury may borrow. Hitting it without a raise risks a default. is public and permanent at congress.gov. Look up how your members voted. Then ask one question: do I want to renew their contract in November?
  1. Check who owns your news. An outlet may answer to a parent company, a billionaire owner or its advertisers. That shapes what it covers and what it skips. You do not have to stop reading it. Test it. Look up who owns it, and trace its big claims back to the original numbers, including ours.
  1. Test any debt claim with an AI. Paste this into ChatGPT, Claude, Perplexity or Gemini with web search on:
  1. Check the number yourself. Treasury's Debt to the Penny updates every business day. The Peterson Foundation tracks the interest bill each month. Both are free.
  1. Carry the five-door test. When someone promises to fix the debt, ask which door they chose and who pays.
  1. Bring one other person. Show one person that China does not own America, or that the tax cuts were borrowed. Tell them the sources are linked at the bottom, and to check them.

Pressure works. News reports say that in 2011 Bank of America dropped a planned $5 debit card fee within weeks after customers objected. In 2012, a public blackout was followed within days by Congress pulling two internet bills.

Right now only about 2% of Americans name the debt as the country's top problem, according to Gallup, as the Council on Foreign Relations noted in August. That is why nobody is running on it. Make them.

The Half-Truth Detector — run it yourself

This is the prompt behind our own fact-checking tool. Paste it into any AI with web search on, add a claim or an article, and it returns two tables: every load-bearing claim with its full context and a verdict, then a second table of the actual sources with links. It grades what is factual, what is misleading, and what has no support — including on us.


Part 12 of 13

The claims you keep hearing, checked

"China owns our debt." False. China holds about $618 billion of more than $40 trillion.

Horizontal bars for Japan, the UK, China, all foreign holders, and total U.S. debt
What to see: China is third among foreign holders and tiny next to the whole pile. Most debt is owed at home.Chart from the article’s numbers. Source: Treasury TIC, July 2026.

"We can grow our way out." Growth helps. But on the Committee for a Responsible Federal Budget's projection, the interest rate on the debt would pass the growth rate by 2029.

"Tariffs will pay it down." The Supreme Court struck down most of them, and about $100 billion to $110 billion has gone back out in refunds.

"The tax cuts pay for themselves." They did not. The deficit this year is about $2 trillion, and corporate tax collections are down about a quarter.

"Cutting waste will fix it." Tightening fraud is worth doing. It is a small piece of a $40 trillion problem.

"You won't feel it." You already do: in an interest bill the size of the military budget, and in the rate on your next loan.


Part 13 of 13

Where this leaves you

The debt is not a force of nature. It is a list of choices with dates, votes and price tags.

Some of that borrowing bought things the country needed in a crisis, and it ended. The part that keeps growing was chosen, and chosen again last year: tax cuts at the top, made permanent, paid for partly by cutting health care and food at the bottom, and borrowed for the rest. Now lenders are charging more, and that cost is reaching your mortgage and your car loan.

It is a hidden tax nobody voted for. But the people who wrote it were elected. Look up their votes. Then use yours.

Bar chart of interest per household at 7900 dollars today and 17000 by 2036
What to see: the household interest bill more than doubles on the current path.Chart from the article’s numbers. Source: CRFB.

Part 14 of 13

Don't take our word for it

Every number above has a source below. Open a link and check.


Sources

Every link below opens in a new tab. They are grouped by who published them. A link is listed only if it backs a claim in the article. Government pages load in a normal browser even though some block automated checkers.

U.S. Treasury

Peterson Foundation

Congressional Budget Office (CBO)

Committee for a Responsible Federal Budget (CRFB)

Social Security Trustees

MeidasTouch / Meidas+

News coverage

ITEP

  • CBS News MoneyWatch, July 9, 2026 — winners and losers one year after the 2025 law; Jon Whiten of ITEP on the top 1%; SNAP and Medicaid enrollment.
  • ITEP — more than 70% of net tax cuts to the richest fifth; less than 1% to the poorest fifth.

Tax Policy Center

White House / Moody's / other official

Federal Reserve

🎧 Listen to the teaching version — --:--
0:00 / --:--

Watch the explainer

The short film version of this story.

Play the audio and the sentence being read lights up. Tap any sentence to jump there, or press Play this box on a box.

Teach me from scratch: the national debt

This side teaches the article from zero. Each part starts with a gold box that explains the idea you need first. Then the lesson walks through it in small steps. Hard words get explained when they show up.


Part 1 of 13

The bill you already pay

What this part is about

The government pays interest on everything it has borrowed. This year that interest passed $1 trillion, which is about as much as the whole military budget. This part shows what interest is, how big the bill is for one family, and how it is starting to reach the rate on your own loans.

Now the lesson, step by step ↓
Go deeper

Say you borrow $1,000 on a credit card at 5%. Every year you owe $50 just for having the loan. That $50 buys you nothing. Now make the loan $40 trillion. At the government's average rate of about 3.5%, the yearly interest is well over $1 trillion. Split across every household in the country, the Committee for a Responsible Federal Budget says that comes to about $7,900 each.

When you borrow money, you pay it back later. On top of that, you pay extra for the time you had it. That extra is called interest. Think of it as rent on money.

Bar chart of interest at 1.02 trillion dollars beside defense at about 885 billion
What to see: the interest bar is taller. Interest now costs more than the whole military.Chart from the article’s numbers. Sources: Peterson Foundation; CBO.

The government borrows a lot, so it pays a lot of rent.

Through August, the government paid $1.02 trillion in interest this year. That is the first time the yearly bill passed a trillion dollars. The Peterson Foundation keeps a running count every month.

The White House budget office calls this year's military budget a historic $1 trillion, the first time it has reached that mark. So the country now pays about as much in interest as it spends on its whole army, navy and air force.

Interest does not build anything. It is money paid out because of money spent in the past.

The Committee for a Responsible Federal Budget split the bill by household. It comes to about $7,900 per household today. If nothing changes, it reaches about $17,000 per household by 2036.

You never get that bill in the mail. You pay it three quiet ways:

  • Some of your taxes go to interest instead of roads or schools.
  • Programs you count on get squeezed to make room.
  • The rate on your next loan goes up.

That last one is new this year. In September, the rates on long-term government bonds hit their highest point in about twenty years. Banks set mortgage and car-loan rates by looking at those bond rates. So when bond rates climb, your loan rates climb with them.

The key thing to remember: Interest on the debt passed $1 trillion this year, about the size of the whole military budget, and it is starting to push up the rates on ordinary people's loans.

Bar chart of interest per household at 7900 dollars today and 17000 by 2036
What to see: the household interest bill more than doubles on the current path.Chart from the article’s numbers. Source: CRFB.

Part 2 of 13

What the national debt actually is

What this part is about

Two words get mixed up all the time: deficit and debt. This part teaches the difference with a bathtub, then shows the real numbers Treasury counted on September 28: a little over $40 trillion in all, about $32.4 trillion owed to outside lenders, and about $7.7 trillion the government owes itself.

Now the lesson, step by step ↓
Go deeper

Say you earn $48,000 a year and spend $68,000. The $20,000 gap is this year's deficit. You cover it with a loan. Next year you do it again. After two years your debt is $40,000. The government did the same thing this year: about $4.8 trillion came in and about $6.8 trillion went out. The $2 trillion gap got added to the pile.

Picture a bathtub.

A bathtub with water pouring in from a faucet and draining out a pipe
What to see: taxes pour in, spending drains out. When more drains than pours, that year’s gap is the deficit. The debt is every unpaid gap stacked up.Illustration made for this page. No type on the picture.

The faucet pours water in. That water is taxes.

The drain lets water out. That water is spending: Social Security, Medicare, the military, interest and everything else.

When more goes out than comes in, the tub runs short. That shortfall, for one year, is called the deficit.

The government covers the shortfall by borrowing. It sells IOUs called Treasury bonds. A bond is a promise: "Lend us $1,000 now, and we will pay you back later, plus interest."

The national debt is every yearly shortfall, stacked up over many years and not yet paid back.

Treasury counts it every business day. On September 28, 2026, it was just over $40.1 trillion.

That total has two parts.

The first part, about $7.7 trillion, is the government owing itself. The biggest piece is money borrowed from the Social Security trust fund. For years, Social Security took in more than it paid out, and the law said the extra had to be lent to the Treasury.

The second part, about $32.4 trillion, is owed to outside lenders. That means banks, pension funds, retirement plans, insurance companies, the Federal Reserve and foreign buyers. This part is called debt held by the public. Most economists watch this number, because the government has to keep borrowing in the open market to pay it off and borrow again.

The whole economy makes about $32.6 trillion worth of goods and work in a year. So what we owe outside lenders is now about as big as one full year of everything the country produces. The last time it was that high was right after World War II.

The key thing to remember: The deficit is one year's shortfall. The debt is all the shortfalls added up. What we owe outside lenders is now as big as the whole economy.

Stacked bar of 40.1 trillion dollars split into 32.4 trillion held by the public and 7.7 trillion the government owes itself
What to see: most of the pile is owed to outside lenders. The smaller slice is the government owing itself, including Social Security’s IOUs.Chart from the article’s numbers. Source: Treasury Debt to the Penny.

Part 3 of 13

Who we actually owe

What this part is about

People often say China owns America. This part shows the real list of who holds U.S. debt. Japan is first at about $1.10 trillion, the United Kingdom is second at about $1.00 trillion, and China is third at about $618 billion. Most of the debt is owed to Americans, including their retirement money and Social Security.

Now the lesson, step by step ↓
Go deeper

Line up $40 trillion as 100 pennies. China's share is about 1.5 pennies. All foreign lenders together hold about 23 pennies. The rest belongs to Americans: pension funds, banks, retirement plans, the Federal Reserve and Social Security's own savings.

Foreign buyers hold about $9.25 trillion of U.S. debt. That is a real amount, but it is under a quarter of the total.

Horizontal bars for Japan, the UK, China, all foreign holders, and total U.S. debt
What to see: China is third among foreign holders and tiny next to the whole pile. Most debt is owed at home.Chart from the article’s numbers. Source: Treasury TIC, July 2026.

The biggest foreign lenders, as of July:

  • Japan, about $1.10 trillion.
  • The United Kingdom, about $1.00 trillion.
  • China, about $618 billion.

China's share has been falling. It is now at its lowest in years.

Most of the debt is owed to people and groups here at home. That sounds safe. But think about who "here at home" really is.

It is your pension fund. It is your 401(k). It is the Social Security trust fund that pays your parents and will pay you.

So when someone says, "We can always print more money to pay it," stop and ask: printed money makes each dollar worth less. Whose dollars? A lot of them are ordinary people's retirement savings.

The Social Security part is coming due right now. Social Security now pays out more than it takes in, so it is cashing in the IOUs the Treasury owes it. To pay them, the Treasury has to borrow from outside lenders, at today's higher rates.

The people who check Social Security's math, called the Trustees, say its retirement savings run out in late 2032. After that, unless Congress acts, checks drop to about 78 cents for every dollar promised. Our Social Security lesson explains that part step by step.

The key thing to remember: China holds a small slice. Most of the debt is owed to Americans, and a lot of it is their retirement money.


Part 4 of 13

Borrowing to pay interest on money we already borrowed

What this part is about

The government now borrows partly to pay the interest on its old borrowing. This part shows that loop, like a snake eating its own tail, and explains why the Federal Reserve's rate hike on September 16 makes the loop tighter.

Now the lesson, step by step ↓
Go deeper

Picture paying this month's credit-card bill with a brand-new credit card. The old card's balance goes down. The new card's balance goes up. And the new card charges interest too. Next month you owe more than before, on two cards instead of one. That is the loop the budget is in.

The loop, one step at a time:

A snake made of dollar bills and IOU paper eating its own tail
What to see: the borrowing-to-pay-interest loop. New bonds pay interest on old bonds, and the loop tightens.Illustration made for this page. No type on the picture.
  1. The government spends more than it takes in.
  2. It borrows to cover the gap.
  3. The borrowing comes with interest.
  4. The interest makes next year's gap bigger.
  5. So next year it borrows even more.

Picture a snake eating its own tail. The more it eats, the more there is to eat.

About half of this year's $2 trillion shortfall is interest. So a big chunk of the new borrowing exists only to pay for old borrowing.

The Committee for a Responsible Federal Budget warned in May that, on its projection, by 2029 the interest rate on the debt would grow faster than the economy. After that point, the debt grows faster than the country's income, even if Congress passes nothing new.

The United States has one trick a family does not have. It borrows in its own money, dollars. And the Federal Reserve, the country's central bank, can create dollars. That means the country can always pay its bills in dollars. A country like Greece, which borrowed in money it could not create, could not.

But creating dollars has a cost. If there are more dollars but the same number of things to buy, each dollar buys less. Prices go up. The bill moves from your tax form to the grocery store.

Right now the Fed is going the other way. On September 16 it raised its main rate to between 3.75% and 4%, because prices are rising too fast. That helps fight rising prices. But it also means the government pays more on every new short-term IOU it sells. The snake gets hungrier.

The key thing to remember: The government now borrows partly to pay interest on old borrowing, and each round makes the next round bigger.


Part 5 of 13

The hidden tax nobody voted for

What this part is about

When borrowing leads to rising prices, it acts like a tax that nobody passed. This part shows why that tax takes the most from people who have the least, what Ray Dalio said about paying it in "devalued dollars," and why the people who caused it still had to vote for it.

Now the lesson, step by step ↓
Go deeper

Two neighbors each have $10,000. One keeps it in a checking account. The other owns a small house worth $10,000 more than the loan on it. Prices rise 5% in a year. The checking account still says $10,000 but buys about 5% less. The house price tends to rise with everything else, so that neighbor stays about even. Same starting money, different result.

Normally a tax is a law. Lawmakers vote. The president signs. You see it on your paycheck or receipt.

An ice cube melting on a kitchen counter next to a paycheck
What to see: inflation as a hidden tax. The paycheck looks the same while its buying power melts.Illustration made for this page. No type on the picture.

Rising prices can work like a tax without any of that. When money buys less, you are poorer, even though nobody took money from your wallet.

This hidden tax does not hit everyone the same.

If you own things that go up with prices, like a house, stocks or a retirement account, you have some protection.

If you live paycheck to paycheck and keep your money in checking, you have none. Your dollars are like an ice cube on the counter. They are still there, but they keep shrinking.

People with less money also spend most of it on food, rent, gas and power. Those are often the prices that rise fastest.

Economists at the Federal Reserve Bank of Minneapolis and at Stanford found the same thing: rising prices take a bigger bite from people with less. That is backwards from how most people think taxes should work.

Ray Dalio built one of the world's biggest investment firms. He said his grandchildren and great-grandchildren will be paying off this debt in devalued dollars. Devalued means each dollar buys less.

So it really is a hidden tax nobody voted for.

But that is only half of it. Every dollar of this borrowing was voted on by Congress and signed by a president. Those votes are recorded, with names. You helped choose those people. The tax is hidden. The people behind it are not.

The key thing to remember: Borrowing that pushes prices up works like a tax that hits people with the least the hardest, and the lawmakers who did the borrowing were elected by voters.


Part 6 of 13

How it got this big

What this part is about

This part walks the debt forward from 2001, the last time the books were close to even, when the country owed outside lenders about $3.3 trillion. It covers the wars in Iraq and Afghanistan, the 2003 drug benefit, the 2008 crash, the pandemic, and the tax cuts of 2001, 2003, 2017 and 2025.

Now the lesson, step by step ↓
Go deeper

Imagine a family that got its credit card almost paid off. Then, over twenty-five years: it bought two cars on credit, took a pay cut it chose, paid a big hospital bill, got hit by a layoff, and never stopped paying interest. The card balance tells you the total. The list tells you why.

To understand a big number, start where it was small.

Bar chart of debt held by the public growing from about 3.3 trillion in 2001 to about 32.4 trillion in 2026
What to see: the public debt grew about tenfold in twenty-five years.Chart from the article’s numbers.

Around 2001, the government had just run four years in a row with more coming in than going out. That is called a surplus. Debt owed to outside lenders was down to about $3.3 trillion, roughly a third of the economy.

Today it is about $32.4 trillion. This is what filled the gap, in the order it happened:

Two wars. Brown University's Costs of War project says the wars in Afghanistan, Pakistan, Iraq and Syria cost about $4.4 trillion through 2022, and about $6.6 trillion once future care for veterans is counted. No new tax paid for them. They were borrowed.

Tax cuts in 2001 and 2003. They lowered taxes and were meant to end later. Most were made permanent.

A medicine benefit. In 2003, Medicare started paying for prescription drugs. It was sold as costing about $400 billion. Within months, the estimate rose to $534 billion. No new tax was created to pay for it.

The 2008 crash. Laws in 1999 and 2000 lowered old limits on banks and kept many derivatives away from normal oversight. In 2004, regulators let the brokerage arms of the five biggest investment banks use their own math models to work out part of their safety cushions. By 2008, two of those five were gone. The rescue and the recession that followed created the biggest yearly shortfalls since World War II.

The pandemic. About $3.6 trillion in relief under President Trump and $2.1 trillion under President Biden, much of it passed by both parties.

The 2017 tax cuts, then the 2025 law that made them permanent.

Interest, growing underneath all of it, the whole time.

Both parties show up on that list. But the items on the list are not the same kind of thing. The next part shows the one difference that matters most.

The key thing to remember: From about $3.3 trillion in 2001 to about $32.4 trillion now: wars, a drug benefit, a crash, a pandemic, tax cuts and interest.

Bar chart of debt as a share of the economy: 106 percent in 1946, about 23 percent by the mid-1970s, about 100 percent in 2026
What to see: after WWII the pile shrank relative to the economy. Today it is back near wartime size.Chart from the article’s numbers. Source: RAND for the postwar path.

Part 7 of 13

The tax cuts that never expire

What this part is about

Some borrowing stops by itself when an emergency ends. Tax cuts made permanent never stop. This part shows who got the 2025 tax law's cuts, using the Tax Policy Center's numbers: about $75,000 a year for the average top 1% household and about $286,000 for the top 0.1%. It also shows what was cut to help pay for them: about $1.1 trillion from health care and about $187 billion from food help.

Now the lesson, step by step ↓
Go deeper

Think of two kinds of spending in a household. One is a hospital bill after an accident. It is huge, but it ends. The other is a monthly bill that never ends, like a car payment with no final payment date. After ten years, the never-ending bill can cost more than the accident did. A permanent tax cut is the never-ending kind.

Emergency spending has an off switch. The pandemic money was huge. Then the checks stopped and the programs closed. It went up and came back down.

Bars for average 2026 tax cuts at the top 1 percent and top 0.1 percent beside ten-year health and food cuts
What to see: the biggest average cuts went to the top. Health and food programs were cut to help pay.Chart from the article’s numbers. Source: Tax Policy Center.

A permanent tax cut has no off switch. Every year it lowers how much money comes in. Every year the government borrows to cover it. Every year interest piles up on that borrowing.

The 2017 tax cuts were written to end in 2025 for most people. In 2025, Congress and President Trump passed a law that made the main 2017 cuts permanent. The Congressional Budget Office and the Joint Committee on Taxation say the law adds about $4.1 trillion to the debt over ten years, counting interest.

Who got the money?

  • The Institute on Taxation and Economic Policy found more than 70% of the tax cuts go to the richest fifth of Americans.
  • Less than 1% goes to the poorest fifth.
  • The top 1% get about $1 trillion over ten years, according to the same group's deputy director, Jon Whiten, speaking to CBS News.
  • The Tax Policy Center says the average top 1% household gets about $75,000 this year. The top 0.1% get about $286,000 each.

How was part of it paid for?

  • About $1.1 trillion was cut from health care over ten years, mostly from Medicaid. Medicaid is health coverage for people with low incomes, including many nursing-home residents.
  • About $187 billion was cut from food help and related programs.
  • CBS reported that more than 4 million fewer people were getting food help by March.

So the people at the top got their tax cuts, and part of the cost was paid by cutting Medicaid and food help for the poorest families. The tax cuts were locked in at the top. The difference was borrowed. That borrowing is part of the $40 trillion, and everyone pays interest on it, including the families who lost coverage.

Corporate tax money is down too, about $95 billion this year, a 24% drop, according to the American Action Forum.

The key thing to remember: The pandemic spending ended. The tax cuts were made to never end, most of the benefit went to the top, and the gap was borrowed.


Part 8 of 13

2026 on the credit card

What this part is about

The "tab" is the debt. This part adds up three new things charged to it in 2026: a war, a tariff plan that fell apart in court, and a promise of checks that nobody has figured out how to pay for. The point is simple. Money that is spent or promised without being collected gets added to what the country owes.

Now the lesson, step by step ↓
Go deeper

A tariff is a tax on things brought in from other countries. The company bringing them in pays it at the border, then usually raises its prices. Kiel Institute research found U.S. buyers ended up paying about 96 cents of every tariff dollar. So when the court ordered the money returned, it went back to the importers. The shoppers who paid the higher prices do not get a refund.

A war on borrowed money. The Iran war had cost $43.6 billion by September, the Pentagon's own estimate. The Pentagon asked Congress for $67.1 billion in extra money, partly to cover those costs. No tax was raised to pay for it. It goes on the debt. The war also pushed oil prices up, which pushed other prices up, which is part of why interest rates are rising.

Tariffs that were supposed to pay it down. The administration said tariffs would bring in enough money to shrink the shortfall. On February 20, the Supreme Court ruled 6 to 3 that the emergency law used for most of those tariffs did not give the president that power. By late July, about $100 billion had been paid back. By August, the American Action Forum counted about $110 billion.

Line chart of 10-year and 30-year Treasury rates in late September 2026, with the 30-year touching 5.61 percent
What to see: both long rates climbed through the week. The 30-year’s 5.61% touch is the highest since 2002.Chart from VERIFY.md / Fed H.15 and CNBC for the Sep 29 high.

A promise with no price tag. President Trump has floated $5,000 checks. Mick Mulvaney, his former chief of staff, said on Fox Business that the real cost would be about $1.3 trillion, and that it would add to the debt and push prices and interest rates higher.

Treasury Secretary Scott Bessent, who runs the government's borrowing, told CNBC in August that there is nothing magic about $40 trillion and that the country can grow its way out.

Growing your way out means the economy has to grow faster than the interest piles up. The Committee for a Responsible Federal Budget says that stops being true around 2029.

The key thing to remember: This year the country borrowed for a war, lost most of its tariff money in court, and heard new promises with no way to pay for them.


Part 9 of 13

The bond market's warning

What this part is about

The people who lend to America show how worried they are by the interest rate they demand. In September, the 10-year rate closed at 5.24% and the 30-year touched 5.61% during the day, its highest since 2002. This part explains what those numbers mean, why Jamie Dimon and Jerome Powell are worried, and why there is still real hope.

Now the lesson, step by step ↓
Go deeper

Imagine two friends ask to borrow $100. One always pays back fast. The other already owes a lot and keeps borrowing. You might lend to the second friend too, but you would ask for more interest to make it worth the risk. Lenders do the same thing with countries. When they ask for more, it is a signal.

When the government sells a bond, buyers decide what interest rate they will accept. If lots of people want the bonds, the rate stays low. If buyers are nervous, or there are too many bonds to buy, the rate goes up.

Line chart of 10-year and 30-year Treasury rates in late September 2026, with the 30-year touching 5.61 percent
What to see: both long rates climbed through the week. The 30-year’s 5.61% touch is the highest since 2002.Chart from VERIFY.md / Fed H.15 and CNBC for the Sep 29 high.

In September, rates went up a lot:

  • On September 28, the 10-year rate closed at 5.24%, the Federal Reserve's own table shows.
  • The 30-year closed at 5.56%.
  • On September 29, the 30-year closed at 5.59% and touched 5.61% during the day, its highest since 2002, CNBC reported.

In August, a 30-year bond sale had drawn fewer buyers than expected.

The Treasury tried to calm things. In August it announced bigger bond buybacks, and in September one buyback hit $6 billion, triple the usual. Rates kept rising anyway.

Other things are pushing rates up too: high oil prices from the war, prices that keep rising, and companies borrowing heavily to build AI data centers. But put the pieces together. Record borrowing. More bonds every month. Weak demand at a big sale. Buybacks that did not work. The evidence points to lenders wanting more money to hold American debt, and the size of the debt is part of why.

Three people who watch the debt closely have said so out loud:

  • Jamie Dimon, who runs JPMorgan Chase, the country's biggest bank, said in April that if things keep going this way, there will be some kind of bond crisis.
  • Jerome Powell, who was running the Federal Reserve, said in March that the debt's path is not sustainable.
  • Phillip Swagel, director of the Congressional Budget Office, wrote in February that the path is not sustainable.

That is the scary part. Now the hopeful part, which is also true.

After World War II, the debt was 106% of the economy. By the mid-1970s, it was down to about 23%. The economy grew fast, budgets were steady, and some inflation helped. The dollar is still the money the whole world uses most. Most of the debt is owed at home. The country has climbed out of a hole this deep before.

The key thing to remember: Lenders are asking for more interest to lend to America, which is a warning, but the country has fixed a debt this big before.


Part 10 of 13

The five ways out, and the catch in each

What this part is about

There are only five ways to shrink a debt: raise taxes, cut spending, print money, grow the economy, or tighten real waste and fraud. This part explains each one, the catch that comes with it, and why experts like Ray Dalio say you need some of several.

Now the lesson, step by step ↓
Go deeper

A family deep in debt has the same five choices. Earn more (raise taxes). Spend less (cut spending). Pay with money that is worth less, which a family cannot do but a country can (print money). Get a better job so income grows (grow the economy). Stop paying for things it never uses, like forgotten subscriptions (waste and fraud). Most families that get out use several at once.

1. Raise taxes. More money comes in. The 2025 law went the other way at the top, so undoing those top-end cuts is the most obvious place to start.

Five labeled doors for raising taxes, cutting spending, printing money, growing the economy, and tightening waste, each with its catch
What to see: five real doors, each with a catch. No painless sixth door exists.Teaching diagram drawn from the article’s five-door frame.

2. Cut spending. Social Security, Medicare, Medicaid and interest already take most of the budget. Cutting everything else to zero would still not close the gap. And cuts to health care and food hurt people with the least room to handle them.

3. Print money. The debt shrinks in real value, but prices rise. People without houses or stocks pay the most.

4. Grow the economy. The best option. But the economy has to grow faster than the interest piles up, and nobody can just order that.

5. Tighten real waste and fraud. Medicaid is health care for tens of millions of people. That is not waste. But any huge program has some mistakes, overpayments and scams inside it. The fix is to find those leaks and close them, not to shut the program down. It helps, but it is not big enough to fix the debt by itself.

Ray Dalio, the Congressional Budget Office and budget watchdogs all say the same thing: no one door is enough. You need a little of several. A group from both parties said that in 2010. Washington walked away from it.

If a politician promises a painless fix, they are selling a sixth door that does not exist.

The key thing to remember: Every way out has a cost, and any real plan uses more than one.


Part 11 of 13

What you can actually do

What this part is about

This part turns the lesson into action: find your own House member and senators, look up how they voted on the 2025 tax law and the debt ceiling, check who owns your news, test claims with an AI, and use the five-door question on anyone who promises a fix. MAKE THEM ACCOUNTABLE.

Now the lesson, step by step ↓
Go deeper

A roll call is the official list of how each lawmaker voted. It is public forever. If you type a bill's name into congress.gov, you can see yes or no next to every name. Checking your own two senators and one House member takes about five minutes.

You are not just someone this happens to. You get a say.

A person at home connected by a thread to a politician in a legislature chamber
What to see: your vote is attached to their vote. The caption, not the picture, names the person “YOU.”Illustration made for this page. No type on the picture.

Find your politicians. Not the famous ones. Yours. You have one House member and two senators. Our Voter tool shows all three and their records in one place. MAKE THEM ACCOUNTABLE.

Look up the votes. Every vote on the 2025 tax law and on raising the debt limit is public. Look up yes or no for your three people.

Check who owns your news. Every news outlet is owned by someone: a company, a rich owner, or a group. That can shape what it covers. Look up who owns the one you use most.

Test claims with an AI. Our article side has a ready-made prompt. Paste it into an AI chat with web search on, and it will check a debt claim for half-truths.

Check the numbers yourself. Treasury's Debt to the Penny updates every business day. It is free.

Use the five-door question. When anyone promises to fix the debt, ask: which door, and who pays?

Tell one person. Show someone that China does not own America, or that the tax cuts were borrowed. Send them the sources.

Pressure works. News reports say that in 2011 Bank of America dropped a new $5 fee after customers pushed back. In 2012, public anger was followed within days by Congress pulling two internet bills.

Right now only about 2% of Americans call the debt the country's top problem, according to Gallup. That is why candidates ignore it.

The key thing to remember: Find your three lawmakers, look up their votes, and use your ballot in November.


Part 12 of 13

The claims you keep hearing, checked

What this part is about

This part checks six things people say about the debt, using the numbers from this lesson: China's $618 billion, the 2029 interest warning, the $100 billion in tariff refunds, the $2 trillion shortfall, the size of waste and fraud, and the $1 trillion interest bill.

Now the lesson, step by step ↓
Go deeper

When you hear a claim, ask two questions. What number would prove it? And does that number exist? "China owns us" should mean China holds most of the debt. The number says China holds about 1.5%. The claim fails its own test.

"China owns our debt." No. China holds about $618 billion out of more than $40 trillion.

Horizontal bars for Japan, the UK, China, all foreign holders, and total U.S. debt
What to see: China is third among foreign holders and tiny next to the whole pile. Most debt is owed at home.Chart from the article’s numbers. Source: Treasury TIC, July 2026.

"We can grow our way out." Growth helps. But on the Committee for a Responsible Federal Budget's projection, the interest rate on the debt would grow faster than the economy by 2029.

"Tariffs will pay it off." The Supreme Court struck most of them down, and about $100 billion to $110 billion went back out in refunds. But even if every tariff dollar had stayed in the Treasury, and no matter who paid it, the money would be small next to a $2 trillion shortfall in a single year and a debt of more than $40 trillion. Tariffs never came close to paying it off.

"The tax cuts pay for themselves." The shortfall this year is about $2 trillion, and corporate tax money is down about a quarter.

"Cutting waste will fix it." Worth doing. Too small to fix it alone.

"You won't feel it." You already do: an interest bill the size of the military budget, and higher rates on loans.

The key thing to remember: Every one of these claims can be checked against a real number, and most of them fail.


Part 13 of 13

Where this leaves you

What this part is about

This last part pulls the whole lesson together: the $40 trillion is a list of choices with dates and votes, the biggest never-ending piece was the tax cuts, and the bill is now reaching your loans through higher rates.

Now the lesson, step by step ↓
Go deeper

If you had to explain this lesson in three sentences to a friend: The government owes over $40 trillion and pays about as much in interest as on the military. The part that keeps growing is mostly tax cuts at the top that were made permanent. They were paid for with borrowed money, and the interest on that borrowing keeps growing the debt. Lenders are now charging more, and that shows up in your mortgage and car loan.

The debt is not weather. It is a list of choices.

Some borrowing paid for real emergencies, and it ended. The part that keeps growing was chosen, and chosen again last year: tax cuts at the top, made permanent, partly paid for by cutting health care and food help at the bottom, with the rest borrowed. Because the tax cuts for the wealthiest were borrowed, they grew the debt. They keep growing it, because the interest on borrowed money adds a little more to the debt every year, even if nobody votes for anything new.

Now lenders want more interest, and that is showing up in the rates on ordinary people's loans.

It is a hidden tax nobody voted for. But the people who wrote it were voted in. Look up their votes. Then use yours.

The key thing to remember: The debt is choices, the choices have names, and the names are on your ballot.

Bar chart of interest per household at 7900 dollars today and 17000 by 2036
What to see: the household interest bill more than doubles on the current path.Chart from the article’s numbers. Source: CRFB.

Sources

Every link below opens in a new tab. They are grouped by who published them. A link is listed only if it backs a claim in the article. Government pages load in a normal browser even though some block automated checkers.

U.S. Treasury

Peterson Foundation

Congressional Budget Office (CBO)

Committee for a Responsible Federal Budget (CRFB)

Social Security Trustees

MeidasTouch / Meidas+

News coverage

ITEP

  • CBS News MoneyWatch, July 9, 2026 — winners and losers one year after the 2025 law; Jon Whiten of ITEP on the top 1%; SNAP and Medicaid enrollment.
  • ITEP — more than 70% of net tax cuts to the richest fifth; less than 1% to the poorest fifth.

Tax Policy Center

White House / Moody's / other official

Federal Reserve

← All explainers
0:00