🎧 Listen to this article — 20:10
0:00 / --:--

Watch the explainer

Prefer to watch? This narrated companion walks through the teaching version of the article.

How do you want to read this?
🎧 Listen — teach me from scratch — 45:36
0:00 / --:--
This is the whole article, taught from zero, one part at a time. Above each part, a short box teaches the one idea you need before you start it. Hard words are explained the first time they come up. You never need to go anywhere else — just read straight down.
You will see some of the same sentences and numbers here as in the article. That is expected: this side covers the same facts, but explains each idea first, one step at a time.
💡 The idea you need for this part

Below, the article sets up the whole question like a trial: the evidence goes on the table, and then the other side answers it. First comes a count of what scientists have published. In 2013, John Cook's team went through about twelve thousand climate studies. A study is a piece of research that other scientists check for mistakes before it is printed. Of the studies that took a side, about 97 in every 100 said the warming is real and people are causing it. In 2021, Mark Lynas's team counted again and got past 99 in every 100. NASA and the national science academies say the same. Then the article sets the rule for everything after it: because the evidence leans that far, the hoax side has to break it, not just doubt it. Last, it promises the skeptics a real hearing, through a July 2025 report for the U.S. Department of Energy.

↓  the part it explains is right below
🔍 Go deeper — the one idea to get first

Why doubt is not enough. Picture a class of 100 students. Each one measures the same table with a tape measure, and 99 of them get the same length. One student says, “I'm not sure that's right.” Being unsure does not change the table. To win, that student has to show how the other 99 measured wrong. This is called the burden of proof: the job of proving falls on the side that goes against the evidence. The article puts the hoax claim in that student's place.

The Question

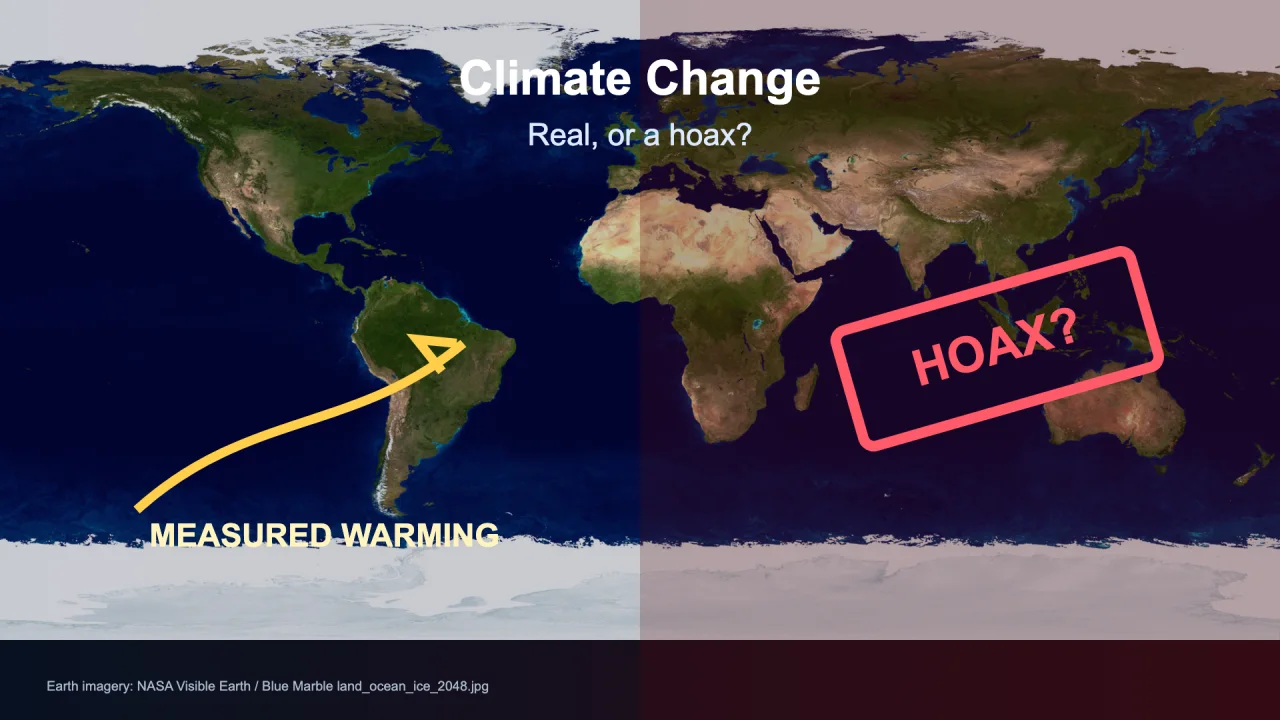
Climate change: real or hoax?

You've heard climate change called the end of the world. You've heard it called a scam. Both can't be true. So this article treats it like a trial. The evidence goes on the table. Then the other side answers it. You see all of it.

Start with what the scientists themselves concluded. In 2013, a team led by John Cook went through the short summaries of about twelve thousand climate studies. These were studies checked by other scientists before they were published. Some of the studies did not take a side. Of the ones that did, about 97 in every 100 said the warming is real and people are causing it.

In 2021, a team led by Mark Lynas ran the same kind of count again, on three thousand newer studies taken from a pool of eighty-eight thousand. By then, agreement had climbed past 99 in every 100.

Three panels: a 97-out-of-100 dot field labeled Cook 2013, a greater-than-99-out-of-100 dot field labeled Lynas 2021, and a NASA globe labeled national academies.
Each dot is one study. The few dark dots are the ones that disagreed.From the Undastandable film.

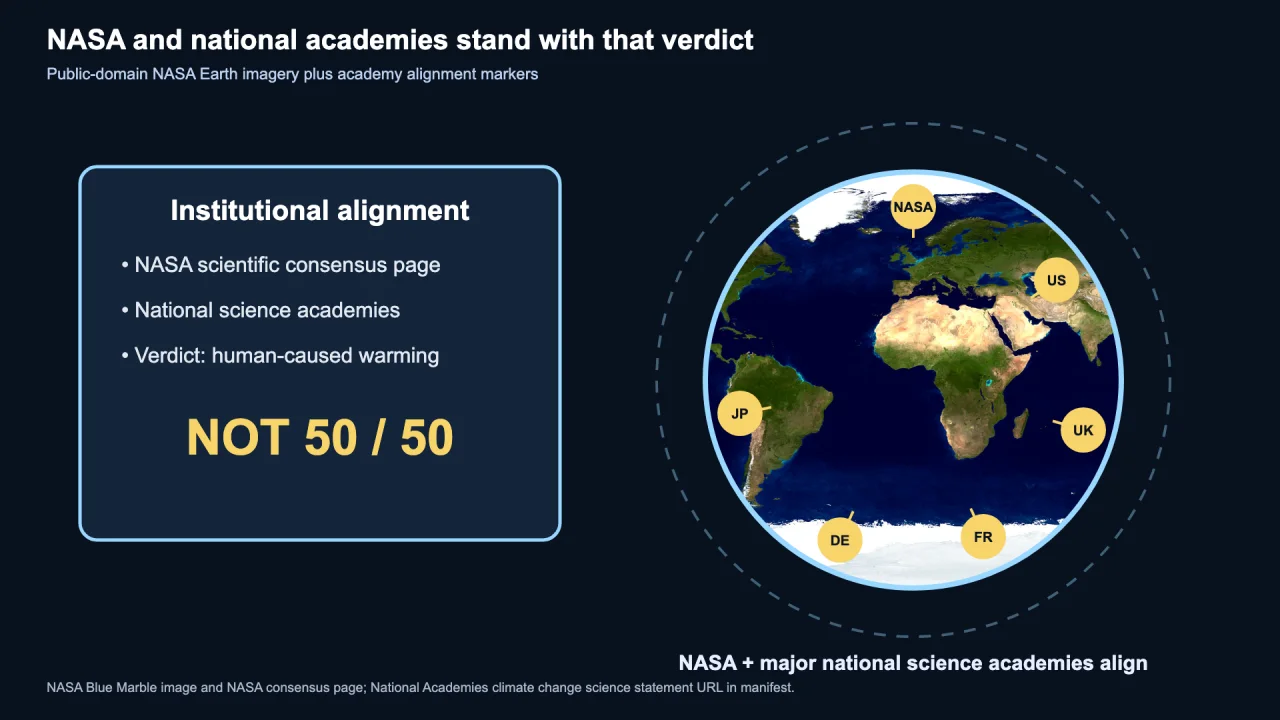
NASA says the same thing. NASA is the United States space agency, and it runs the satellites that watch Earth. So does every major national academy of sciences. A national academy is a country's top group of scientists.

When the evidence leans that far one way, it counts as established fact. The job of proving now sits with the hoax claim. Doubt on its own does not win. The hoax claim has to break the evidence. The rest of this article runs that test in front of you.

The skeptics get a real hearing too. In July 2025, the U.S. Department of Energy published a review. The Department of Energy, often called DOE, is the part of the government in charge of energy. The review was written by five qualified scientists who argue the alarm is overstated. They make some fair points, and each one is graded later on. You'll also see where that report came from, because where a case comes from is evidence too.

A globe with markers for the United States, United Kingdom, France, Germany and Japan, beside a panel reading NASA scientific consensus page, national science academies, verdict human-caused warming, not fifty-fifty.
It isn't one country's agencies. The national science academies of the major countries all landed in the same place.From the Undastandable film.

The key thing to rememberAmong the scientists who study this, agreement is about 99 to 1. From here on, the hoax side has to break the evidence, not just doubt it.


💡 The idea you need for this part

Below, the article pins down two phrases that get mixed up: global warming and climate change. One is a single number, Earth's average temperature. The other is everything that number sets in motion, from the oceans to the storms. Then the article uses a fever to show why a couple of degrees is a big deal, and it ends with three places you would notice it: your rain, your mountain snow and your grocery bill.

↓  the part it explains is right below
🔍 Go deeper — the one idea to get first

How an average works. Earth's average temperature takes readings from all over the planet, hot places and cold places, day and night, all year, and combines them into one number. Say one town's temperature over five days is 60, 65, 70, 75 and 80 degrees. Add them up and you get 350. Divide by five and the average is 70. Now picture every town, every ocean and every day of the year combined into one number like that. To push that giant average up by even one degree, the whole planet has to hold a lot more heat.

The Definition

What does "climate change" actually mean?

Most news coverage never defines these words.

Global warming is the thermometer reading. It means Earth's average temperature is going up.

Climate change is everything that extra heat then pushes on: the oceans, the ice, the rainfall, the storms and the growing seasons. A growing season is the part of the year when crops can grow.

A circle reading 99.5 labeled mild fever in one body, an arrow to a warming Earth, and beside it houses with the sea rising into them.
Same small number, two very different results.From the Undastandable film.

A person with a small fever is not very sick. A planet with a small fever moves its coastlines. That is how a couple of degrees, which sounds like nothing, ends up changing your rain, the snow that piles up in the mountains each winter, and your grocery bill.

The key thing to rememberWarming is the temperature. Climate change is everything the extra heat does.


💡 The idea you need for this part

Below, the article explains what CO2 is and how much of it people have added. It starts with the gas itself: invisible, always in the air, used by plants, and not poisonous at outdoor levels. Then come the two numbers to hold onto. Before industry, the air held about 280 parts per million of CO2. In May 2026, an instrument on the Mauna Loa volcano in Hawaii showed 432. Most of the extra came from burning coal, oil and gas, and most of the rest from cutting down forests. The last point is speed: NASA says CO2 is now rising about 250 times faster than when Earth came out of the last ice age.

↓  the part it explains is right below
🔍 Go deeper — the one idea to get first

What “parts per million” means. Scientists count CO2 in parts per million. That means: out of every million molecules of air, how many are CO2? Picture a stadium holding exactly one million people. Before industry, 280 of them wore a red hat. In May 2026, 432 of them did. Everyone else is the same. That is still a tiny share of the crowd. It matters anyway, because the red-hat molecules are the ones that catch heat on its way out to space. The next part shows how.

The Building Block

What is CO2, and how much did we add?

CO2, carbon dioxide, is an invisible gas that has always been in the air. Like every gas, it is made of pieces far too small to see, called molecules. Each CO2 molecule is one carbon atom joined to two oxygen atoms. That is where the name comes from: C for carbon, O for oxygen, 2 for two of them. Plants use it. At the levels found outdoors, it is not poisonous. The problem was never that CO2 exists. The problem is how much people have added, and how fast.

Before the industrial era, when factories and engines began burning coal on a large scale, the air held about 280 CO2 molecules in every million molecules of air. Scientists write that as 280 parts per million.

Since 1958, instruments on the Mauna Loa volcano in Hawaii have measured CO2 directly, every day. In May 2026 the reading reached 432 parts per million. That was another new high. It is more than half again as much as before industry, and the highest level in millions of years.

Anything with carbon in it makes CO2 when it burns, and coal, oil and gas are full of carbon. Most of the extra came from burning coal, oil and gas. Most of the rest came from cutting down forests. Trees soak carbon out of the air, so fewer trees means less of it gets soaked back up.

280 ppm — the air before industry 432 ppm — May 2026 1750 1958 — daily measuring starts today Thousands of years to move it before. About 150 years to move it now.
The air held about 280 parts per million for the whole of human history before industry. Since 1958 an instrument on Mauna Loa has read it every day; in May 2026 it read 432.

The speed is the big change. NASA calculates that CO2 is now climbing about 250 times faster than it did when Earth came out of the last ice age. An ice age is a long cold stretch when ice covers much more of the planet. Nature took thousands of years to raise CO2 that much. People did it in about 150 years of industry.

The key thing to rememberFor every two CO2 molecules in the air in 1750, there are three now. We know because it has been measured every day since 1958.


💡 The idea you need for this part

Below, the article answers a fair question: how can a small amount of invisible gas warm a whole planet? It walks through the greenhouse effect in steps. Sunlight warms the ground. The ground sends heat back out as infrared, which is heat you can feel but cannot see. CO2 catches some of that heat and sends part of it back down. Then come two kinds of proof. Scientists showed it in a laboratory in the 1850s. And satellites measured the heat leaving Earth in 1970 and again in 1997. A 2001 study in the journal Nature found less heat escaping in exactly the kinds of infrared that CO2 blocks.

↓  the part it explains is right below
🔍 Go deeper — the one idea to get first

Wavelengths, the idea behind the measurement from space. Light travels in waves, a bit like ripples on a pond. The distance from the top of one wave to the top of the next is called the wavelength. Each color has its own wavelength, and red light has longer waves than blue light. Past red, where your eyes stop seeing, comes infrared, with even longer waves. CO2 catches only some infrared wavelengths and lets the others pass. So if CO2 is holding in more heat, a satellite looking down at Earth should see less infrared coming up at exactly those wavelengths.

The Mechanism

Why does CO2 trap heat in the first place?

It is a fair question. How does an invisible gas, only a tiny share of the air, warm a whole planet? The answer is called the greenhouse effect. It is normal, and life needs it. Without it, Earth would be frozen solid.

Sunlight comes in and warms the ground. The ground sends heat back out as infrared, the heat you can feel but cannot see, like the warmth on your face near a campfire. CO2 catches part of that outgoing heat. It sends some of it back down instead of letting it escape to space. More CO2 means more heat kept.

Sunlight arrives at Earth from the sun; outgoing heat leaves the surface, meets a green greenhouse layer, and part of it is turned back down toward Earth.
Yellow arrows in from the sun. Orange arrows out from the ground. Red arrows are the part the greenhouse layer sends back down.From the Undastandable film.

This is not a new idea, and it is not a computer guess. Scientists showed that CO2 traps heat in a laboratory in the 1850s.

It has also been measured from space. In 1970, a NASA satellite measured the heat leaving Earth. In 1997, another satellite repeated the exact same measurement. In 2001, researchers writing in the science journal Nature found less heat escaping, at exactly the wavelengths where CO2 does its blocking. Newer satellites keep finding the same thing. That is the greenhouse effect, caught from orbit twice, decades apart.

The key thing to rememberCO2 trapping heat is laboratory physics that is about 170 years old, and satellites have measured it happening.


💡 The idea you need for this part

Below, the article gives one idea that clears up a lot of arguing: weather is not climate. Weather is today, in one town, and it jumps up and down. Climate is the pattern over decades, across the whole planet. So one snowy week does not disprove warming, and one day hotter than any before does not prove it. Then Jim Dale, a British weather forecaster, uses a wildfire to split one event into two questions: what started the fire, and what made it so big.

↓  the part it explains is right below

The Distinction

Why doesn't a cold winter settle anything?

One idea clears up most climate headlines, from both directions: weather is not climate.

Weather is today, this week, in one town. It swings up and down on its own. Climate is the pattern over decades, measured across the whole planet. The forecast for tomorrow is weather. Knowing that summer in your town is warmer than winter is climate.

So “it snowed this week, so warming is fake” and “hottest day ever, we're doomed” make the same mistake. Both take one place's short-term weather and treat it as the planet's long-term trend. A trend is the direction something moves over a long time.

Left panel: jumpy blue and red bars labeled weather, today, local, noisy. Right panel: one smooth line labeled climate, decades, pattern, planet-wide.
The bars jump. The line does not. Both are real; they answer different questions.From the Undastandable film.

Jim Dale is a weather forecaster in the United Kingdom, not a campaigner. He explains it with a wildfire. A fire starts with a match, or with someone setting it on purpose. That is the ignition, the start. But the heat, the drought, and the wind decide how bad the fire gets. A drought is a long stretch with too little rain. Those conditions are the climate underneath.

What started the fire and what made it so big are two different questions. Each side online keeps only the half it likes.

Left box labeled ignition shows a small flame. Right box labeled conditions shows three bars: heat, dryness, wind.
Who lit it, and how bad it got, are two separate claims.From the Undastandable film.

The key thing to rememberOne cold week can't erase a fifty-year trend across the whole planet, and one hot week can't prove it.


💡 The idea you need for this part

Below, the article takes a fair skeptic question: nobody had instruments 800,000 years ago, so how can anyone know what the air held back then? The answer is ice. In Antarctica, each year's snow packs into a layer of ice and traps tiny bubbles of that year's air. Scientists drill out a core, a long rod of ice two miles deep, and date the layers the way you count tree rings. Then come two results. Across all 800,000 years, CO2 never went above about 300 parts per million, and today it is 432. And in recent years, the ice and the modern Mauna Loa instrument overlap, and they agree.

↓  the part it explains is right below
🔍 Go deeper — the one idea to get first

Why two measurements agreeing matters. Say two people measure the same room. If they use the same broken tape measure, they will agree and both be wrong. Now say one uses a tape measure and the other counts floor tiles. Those two methods do not depend on each other. If they still get the same answer, both are very likely right. The ice core and the daily instrument on Mauna Loa work like that. One tests bubbles of old air trapped in ice. The other samples the air on a mountain in Hawaii today. For the years both of them cover, they agree.

The Ancient Record

How can anyone know the CO2 level from 800,000 years ago?

A skeptic might say: nobody had instruments back then, so those ancient numbers can't be trusted. But these numbers can be checked, and that is the difference.

You have probably seen layers like these on a road cut or the side of a mountain. They are the striped bands in the rock, each stripe a different age, laid down in order. Ice does the same thing.

Snow falls in Antarctica and packs into ice. Each year's layer seals in tiny bubbles of the actual air that was blowing when it fell. Drill a core two miles deep and you are holding dated samples of ancient air. It is real air, not a guess, and it goes back 800,000 years.

Scientists date the layers the way you would count the rings of a tree. Laboratories on different continents get the same numbers from different cores.

Each stripe is one year’s snow. Sealed inside it: bubbles of the real air that was blowing then. Drill two miles down and you hold 800,000 dated years. the ice core the two records meet Ancient bubbles and modern sensors overlap in the same years — and agree.
Each year of Antarctic snow seals real air inside it. Drilling down is reading back through dated samples of the actual atmosphere.

Across that whole stretch of time, through ice ages and warm spells, CO2 never once went above roughly 300 parts per million. Today it is 432.

Then comes the check. The ice-core measurements and the daily Mauna Loa measurements overlap in modern times, and they agree. Two methods that have nothing to do with each other, old bubbles and modern sensors, draw one unbroken line. For the skeptic to be right, both would have to be wrong, each in its own way, in the same direction.

The key thing to rememberAncient ice and modern instruments are two independent measurements, and they draw one line.


💡 The idea you need for this part

Below, the article tests an idea from 2020. During the COVID lockdowns, people stayed home, the skies looked clearer, and many people decided the problem fixes itself as soon as we ease off. The article gives two reasons it does not. First, the haze you can see, smog and soot, is a different thing from CO2. Smog washes out of the air in days. CO2 stays. Second, a bathtub: burning fuel is the faucet, forests and oceans are the drain, and the drain is smaller. NASA measured the 2020 cut in emissions, the CO2 people put into the air, at about 5.4 percent, and the CO2 level kept rising anyway.

↓  the part it explains is right below
🔍 Go deeper — the one idea to get first

The bathtub, with numbers. Two words first. Emissions are how much CO2 goes into the air each year. The level is the total already up there. The numbers below are made-up round numbers, only to show the idea. Say the faucet pours in 10 cups of water a second and the drain lets out 5. Every second, the tub gains 5 cups. Now turn the faucet down by about 5 percent, near the size of the 2020 cut. It pours about nine and a half cups instead of 10. The drain still lets out 5. The tub still gains about four and a half cups every second. It fills a little more slowly, but it still fills. The water only goes down when the drain takes out more than the faucet puts in.

The Lockdown Test

If the COVID shutdowns cleared the skies, why did CO2 keep climbing?

During the 2020 lockdowns, people were told to stay home to slow the spread of COVID. The skies visibly cleared. A lot of people decided the problem fixes itself the moment we ease off.

But the dirty haze you can see, smog and soot, is a different substance from CO2. Smog washes out of the air in days. CO2 builds up and stays.

the faucet: burning coal, oil and gas the tub: CO2 already in the air the drain: forests and oceans, and it is the smaller pipe
The 2020 lockdowns turned the faucet down about 5.4 percent for one year. The level in the tub kept rising, because a smaller pour is not a drain.

Picture a bathtub. Burning fuel is the faucet. Forests and oceans are the drain, because they take CO2 back out of the air. The drain is smaller than the faucet.

NASA's Jet Propulsion Laboratory is the NASA center that builds and runs its robot space missions. It measured the lockdown cut in emissions at about 5.4 percent for 2020, the biggest sudden cut ever. The CO2 level in the sky kept rising anyway. Turning the faucet down a little does not drain the tub.

At the same time, cutting down forests keeps shrinking the drain.

The key thing to rememberSlowing how fast you fill the tub is not the same as draining it.


💡 The idea you need for this part

Below, the article takes the strongest skeptic question: how do we know the warming comes from people, and not the sun? It starts from something true. The climate has changed before without us. Then it checks four fingerprints, patterns that only one cause leaves behind. One is the split: the air near the ground is warming while the stratosphere, the layer high above, is cooling. A hotter sun would warm both, and a 2023 study led by Benjamin Santer measured the cooling. Two is the carbon's signature: the kinds of carbon in the air are shifting toward the kind found in coal, oil and gas. Three is the satellite measurement from earlier in the article. Four is the nights, which are warming faster than the days. It ends with a limit: these show people drive the trend, not that any single storm was caused by climate change.

↓  the part it explains is right below
🔍 Go deeper — the one idea to get first

The layers of the air, and why the top one is cooling. The air around Earth sits in layers, one on top of another. The bottom layer, where people are and where weather happens, is called the troposphere. The layer above it is the stratosphere. Extra CO2 acts like a blanket between them. Think of a blanket on a bed on a cold night. Under the blanket you stay warm, because it holds your body heat in. The top of the blanket stays cold, because that heat never reaches it. More CO2 is a thicker blanket: warmer underneath, colder on top. A hotter sun would be like turning up the heater for the whole room, so both layers would warm together.

The Fingerprints

How do we know it's us — and not the sun?

This is the strongest fair question a skeptic can ask, and “trust the experts” is not an answer. The skeptic starts from something true. Earth's climate has changed many times without people. Wobbles in Earth's path around the sun, changes in the sun itself, and volcanoes have all done it. So how do scientists tell today's warming apart from a natural one?

They look for fingerprints. Every person's fingers leave a pattern that belongs to them and nobody else. Causes of warming work the same way. Different causes leave different patterns you can measure. So nobody has to argue about it. You can check. There are four fingerprints, each from a different kind of instrument, run by different teams.

One: the split. If a hotter sun were causing the warming, the whole sky would warm together, top to bottom, like a room with a stronger heater. That is not happening. The air near the ground is warming. The stratosphere, the layer of air above the CO2 blanket, is cooling. The blanket keeps heat below it, so less reaches the layer above.

How does anyone measure the temperature that high up? Weather balloons have carried thermometers up there for decades. Satellites have measured it from above since the 1970s. That makes two instrument measurements that do not depend on each other.

Scientists predicted this exact split in 1967, before there were satellites to confirm it. A 2023 study led by the climate scientist Benjamin Santer measured one to two degrees of cooling up there between 1986 and 2022, while the surface warmed. The study called the combined human fingerprint incontrovertible. That means it cannot reasonably be denied.

STRATOSPHERE the layer above the blanket it is cooling TROPOSPHERE the air you breathe it is warming A brighter sun would warm both bands together. This is not that.
The measured pattern: the air near the ground warming while the layer above it cools. Weather balloons and satellites, two separate instrument records, both show it.

Two: the carbon's signature. Coal, oil and gas are called fossil fuels, because they formed underground from things that lived millions of years ago. All carbon atoms are carbon, but they come in a few slightly different versions, and some weigh a tiny bit more than others. Scientists call these versions isotopes. They are sometimes called carbon “flavors.”

The carbon in fossil fuels is missing some of those flavors. As CO2 rose, the mix of carbon in the air shifted toward exactly the fossil-fuel flavor. A volcano or the ocean cannot fake that shift. Their carbon carries different flavors, and laboratories can tell them apart.

Two grids of beads. The left grid, air before the fossil-carbon pulse, has scattered blue beads. The right grid, air afterwards, is mostly orange.
Each bead is a carbon speck. The blue ones are the heavier flavor. As fossil carbon pours in, the mix visibly changes.From the Undastandable film.

Three: the photograph. These are the satellite measurements from earlier: less heat escaping to space at exactly the wavelengths CO2 catches, measured in 1970 and again decades later.

Earth emits infrared upward; a spectrum curve beside it shows a deep notch marked as the CO2 absorption band.
The dip in the curve is heat that used to leave and now doesn't — at exactly the wavelengths CO2 absorbs.From the Undastandable film.

Four: the nights. A blanket that holds in heat works around the clock, so nights warm faster than days. A brighter sun would do the opposite, because the sun only shines in the daytime. Thermometers around the world show the nights warming faster.

Daytime warming Night-time warming A blanket works all night. A brighter sun would do the opposite.
Thermometers worldwide show night-time warming outpacing daytime warming — the signature of held-in heat, not of a stronger sun.

That makes four fingerprints, from four methods that do not depend on each other, all pointing the same way. For “it's natural” to be right, all four would have to be wrong, each on its own, at the same time, in the same direction. Each one can be checked. Together, they are nearly impossible to deny.

One limit, stated plainly. These fingerprints show that people drive the overall trend. They do not show that any single storm or fire was “caused by” climate change. That is a different and harder science. Mixing the two up is the most common error on both sides.

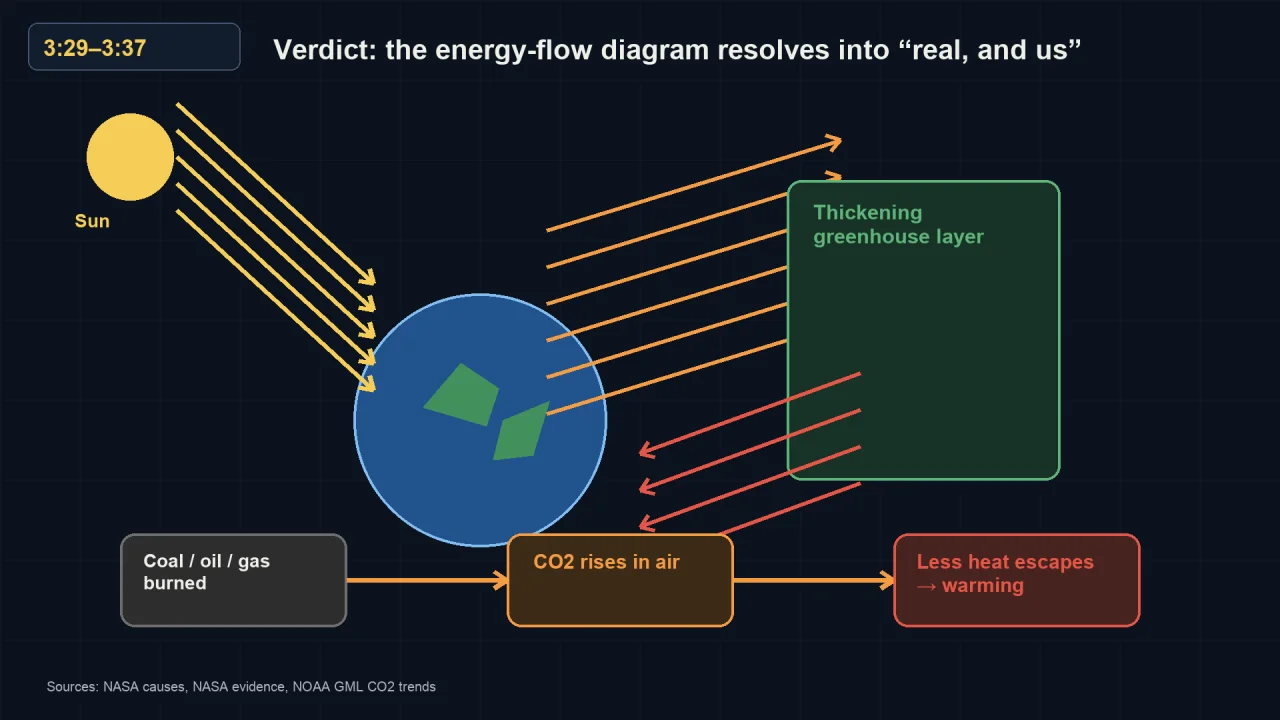
Sun, Earth, a thickening greenhouse layer, and a chain along the bottom: coal, oil and gas burned, then CO2 rises in air, then less heat escapes and warming follows.
The four fingerprints put together: fuel burned, CO2 up, the layer thickens, less heat gets out.From the Undastandable film.

The key thing to rememberFour measurements that do not depend on each other — the split, the carbon signature, the space photograph and the nights — all point at people.


💡 The idea you need for this part

Below, the article follows one chain from burning fuel to your insurance bill, and every link is a measured number. We burn fuel, measured every day since 1958. The air holds more heat: 2015 through 2025 were the eleven warmest years measured. Disasters cost more: a billion-dollar disaster used to hit the United States about every four months, and now it is about every two weeks. NOAA, the U.S. government agency for the ocean and atmosphere, kept that count until 2025, and Climate Central picked it up with the same method. Last, insurers raise their prices. Property insurance is up nearly 70 percent in five years, and in some places companies have stopped selling it at all.

↓  the part it explains is right below
🔍 Go deeper — the one idea to get first

How an insurance price is set. Insurance works like a shared pot of money. These are made-up round numbers, only to show the idea. Say 1,000 homes in a town each pay $1,000 a year. That yearly payment is called a premium. The pot holds $1 million. If fires and floods in that town usually cost about $800,000 a year to fix, the pot covers it, with some left over for the company's own costs. Now say disasters there get worse, and fixing homes starts costing $1.5 million a year. The same pot no longer covers it, so every home's premium has to rise to $1,500 or more. If the damage gets too big to predict, the company may stop selling insurance in that town at all. A rise of nearly 70 percent in five years, the real figure below, turns a $1,000 bill into one of nearly $1,700.

The Cascade

How does a far-off average land on your bill?

This part is not far away. It is already in your mailbox. Follow the chain one link at a time. Every link is a measured number.

We burn fuel measured since 1958 More heat is held 11 warmest years Disasters cost more now about every 2 weeks Insurers reprice your premium Every link in that chain is a measured number.
The path from a fuel receipt to your renewal notice. No step in it is an opinion.

We burn fuel. That has been measured every day since 1958.

The air holds more heat. The years 2015 through 2025 were the eleven warmest years ever measured, according to the World Meteorological Organization, the United Nations' weather agency.

Hotter, drier weather makes disasters more expensive. In the 1980s, the United States averaged one billion-dollar disaster about every four months. Now it is roughly every two weeks. A billion-dollar disaster is one storm, flood, fire or drought that causes at least a billion dollars of damage. Once every four months is about three a year. Once every two weeks is about 26 a year.

NOAA kept that count from 1980 until it was retired in May 2025. Then Climate Central restarted it in October 2025, with the same checked method and the same scientist in charge, so the count goes on.

A house with floodwater across its lower half, an arrow leading to an insurance renewal notice with a rising dollar figure.
Where the chain ends for most people.From the Undastandable film.

Insurers look at those numbers. They don't argue politics. They change their prices. Property insurance is up nearly 70 percent in five years. Part of that is simply that homes cost more, and cost more to rebuild. But the risk of disaster is part of it too. In some regions, companies have stopped writing policies at all. Writing a policy means selling someone insurance.

Nobody asked you to vote on that premium. Its price already includes the new, higher risk.

The debate shows up at home as a bill, whether you follow the science or not.

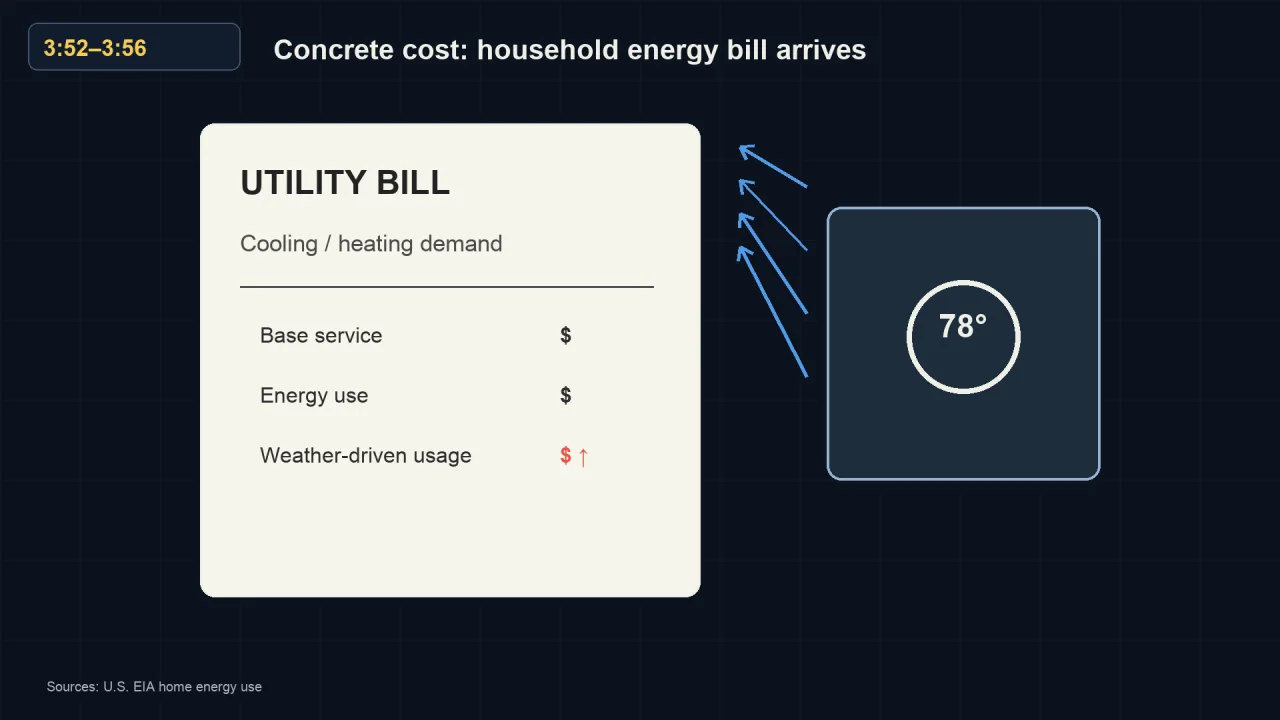
A utility bill listing base service, energy use and weather-driven usage, beside a thermostat reading 78 degrees.
The same chain shows up in a second place: the weather-driven line on your energy bill.From the Undastandable film.
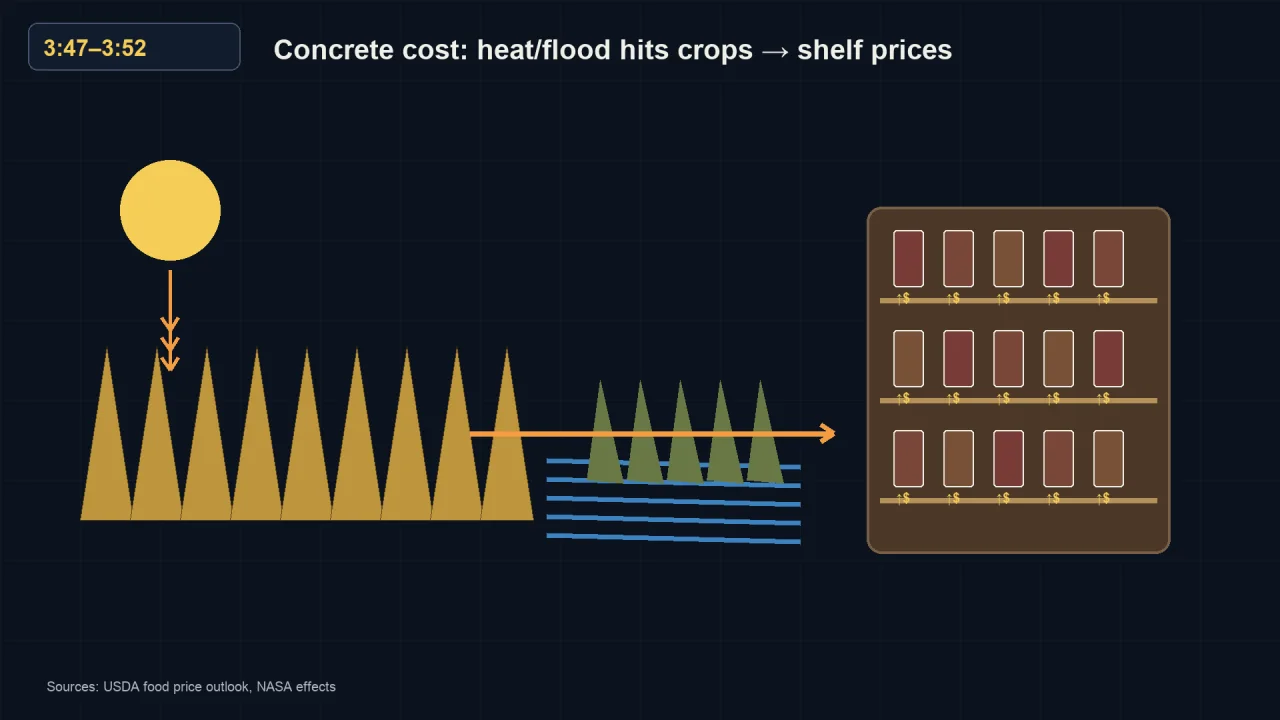
Sun beating down on a dried crop and floodwater across another, with an arrow to supermarket shelves marked with rising prices.
And a third: a bad harvest is a price change on a shelf.From the Undastandable film.

The key thing to rememberBurning fuel traps more heat, trapped heat makes disasters cost more, and those costs land on your insurance bill. Every link is measured.


💡 The idea you need for this part

Below, the article lays out who the skeptical scientists are and exactly what they claim. They are Judith Curry, Roy Spencer, John Christy, Ross McKitrick and Steven Koonin. Energy Secretary Chris Wright brought them together for a July 2025 Department of Energy report. Their three claims: climate models run a bit hot, most kinds of extreme weather show no clear trend yet, and very aggressive net-zero policy, which means pushing a country's added CO2 all the way down to zero, could cost more than it saves. Then comes the answer from more than 85 scientists who say the report picks the studies that suit it. Last, the key line: Koonin himself said 95 percent of the report agrees with, or comes from, the UN's climate panel. So the real fight is at the edges, not over the core.

↓  the part it explains is right below
🔍 Go deeper — the one idea to get first

What a climate model is, and what “runs hot” means. A climate model is a huge set of math rules for how air, water, ice and sunlight behave. Scientists run those rules on powerful computers to see how the climate should change as CO2 goes up. You can check a model after the fact. These are made-up numbers, only to show how. Say a model predicted, years ago, 1 degree of warming by a set year. When that year came, thermometers measured 0.8 degrees. The model predicted 0.2 degrees too much. That is what scientists mean when they say a model “runs hot.” The warming still happened. It came in lower than that model said.

The Real Argument

What are real scientists actually fighting about?

The real disagreement is not what the shouting suggests. This is the genuine argument, with everyone named.

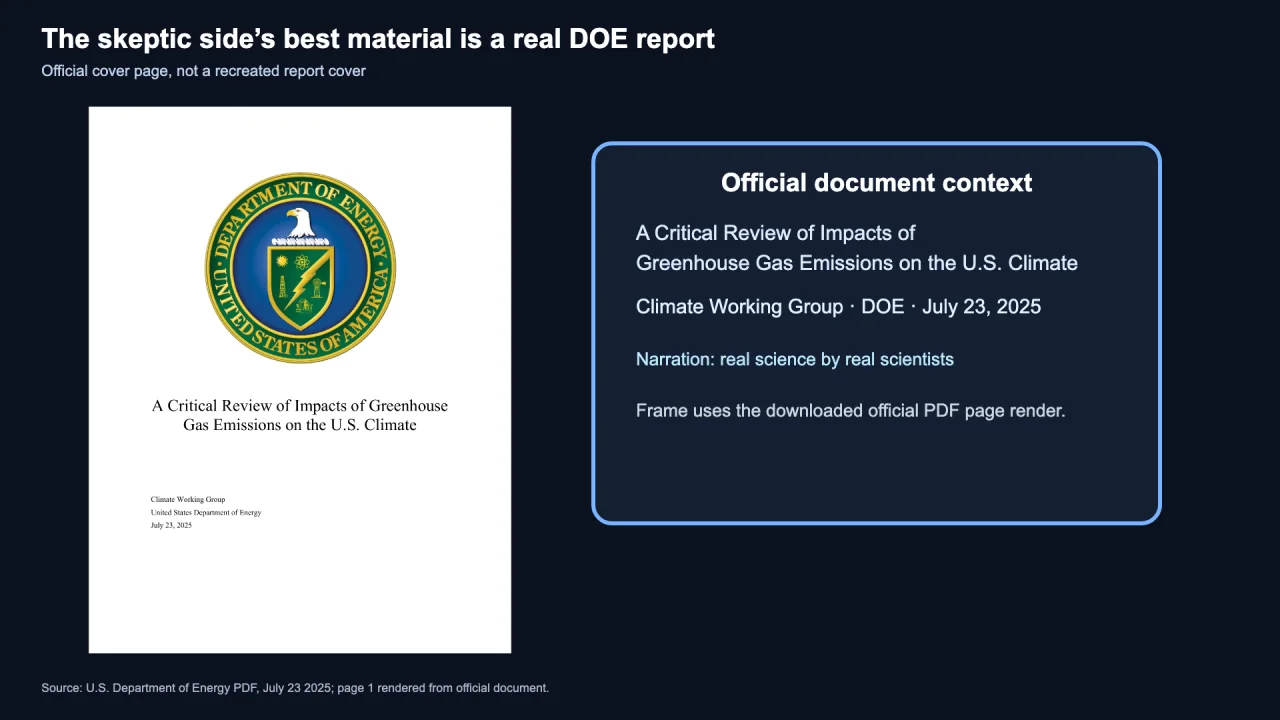
The official cover page of the Department of Energy report, A Critical Review of Impacts of Greenhouse Gas Emissions on the U.S. Climate, dated July 23 2025.
The skeptic side's best material is a real government report, not a blog post. This is its actual cover.From the Undastandable film.
The report's title page beside five named author cards: John Christy, Judith Curry, Steven Koonin, Ross McKitrick and Roy Spencer, each marked Ph.D.
Five named authors, all with real doctorates, reporting to the Energy Secretary.From the Undastandable film.

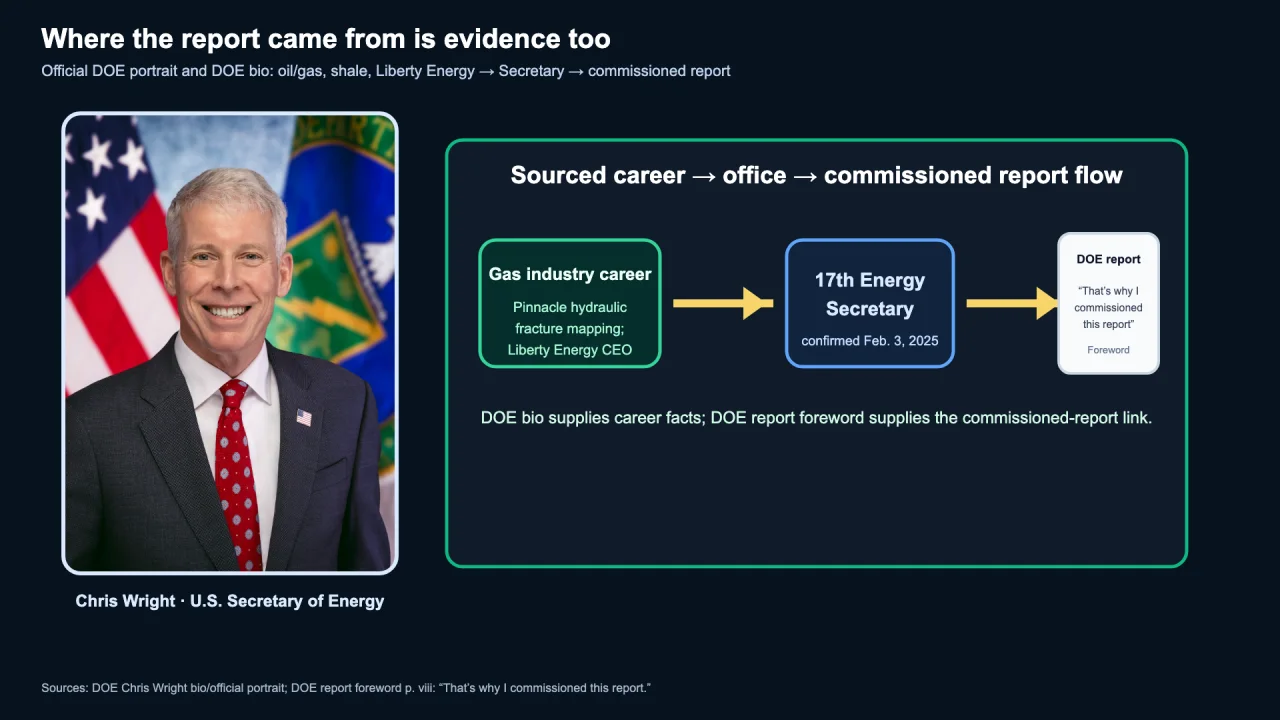
The skeptical side. The July 2025 Department of Energy review was written by five scientists with real credentials. Credentials are the degrees and experience that show someone is trained in a field. The five are Judith Curry, Roy Spencer, John Christy, Ross McKitrick and Steven Koonin. They were brought together by Energy Secretary Chris Wright, who used to run a gas company.

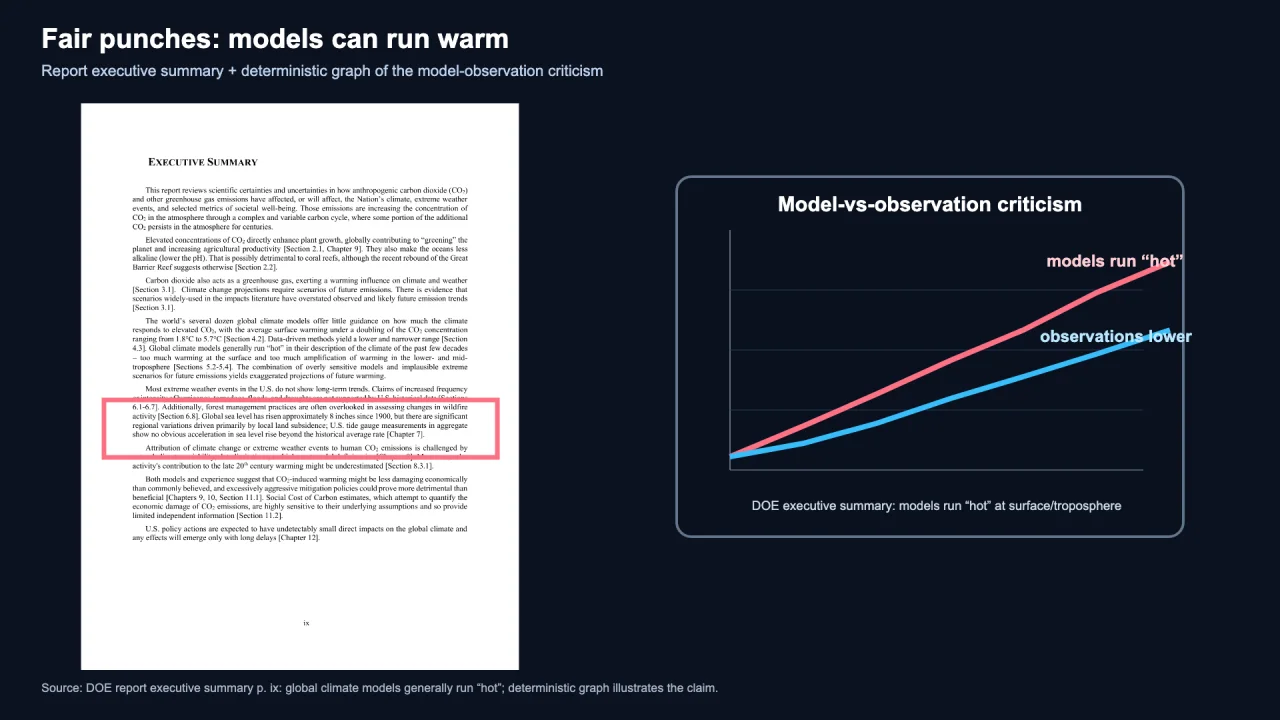
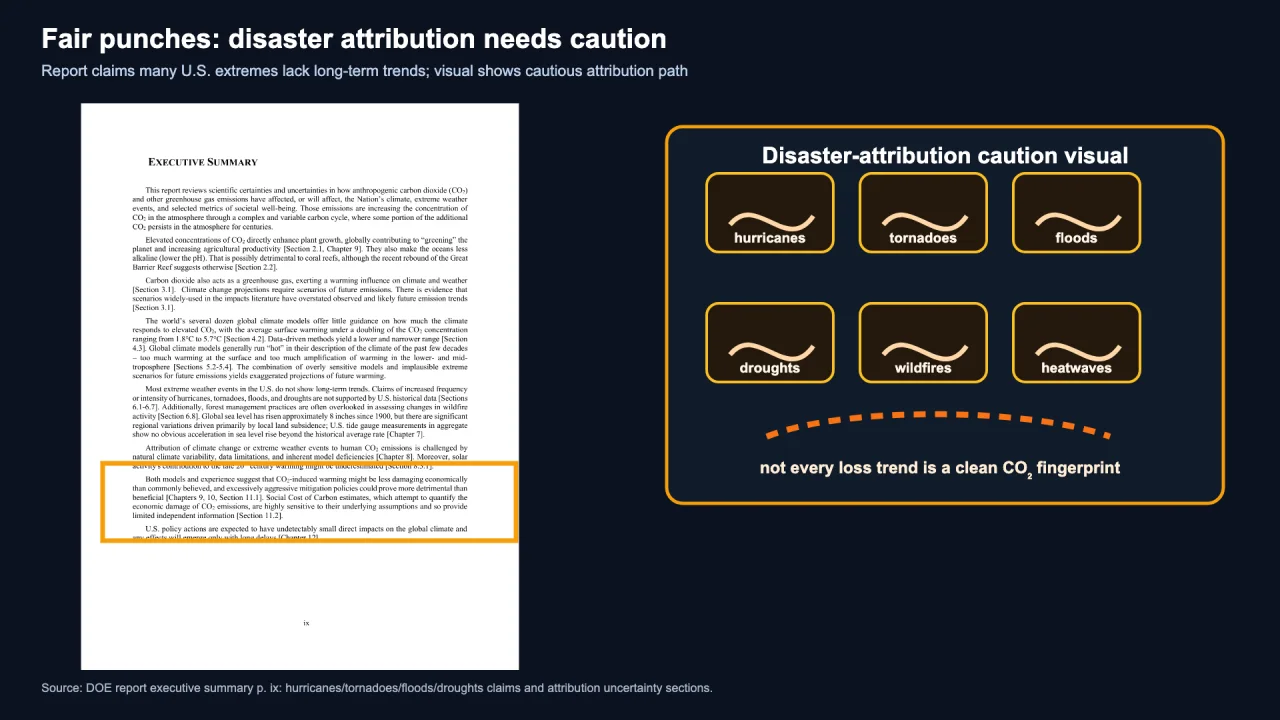
Their actual claims come down to three. One: climate models tend to run a bit hot. Two: most kinds of extreme weather don't yet show a clear trend. Three: very aggressive net-zero policy could cost more than it saves. Net zero means a country adds no more CO2 to the air than it takes back out, for example by growing forests. They also make a point that usually gets left out: extra CO2 has boosted plant growth in some places.

A page of the report's executive summary beside a chart in which the modeled warming line rises above the observed warming line.
Their first fair punch, drawn out: some models predicted more warming than the thermometers later found.From the Undastandable film.
A page of the report beside six tiles labeled hurricanes, tornadoes, floods, droughts, wildfires and heatwaves, under a caption saying not every loss trend is a clean CO2 fingerprint.
Their second fair punch: not every disaster trend traces cleanly back to CO2.From the Undastandable film.

The mainstream reply. More than 85 scientists signed a rebuttal, which is a written answer that argues back. NPR, the public radio network, reported it. The rebuttal says the report picks only the studies that suit it and gives a false picture of the field.

Then Koonin himself said on air that 95 percent of their report agrees with, or is drawn from, the UN's climate panel. That is the IPCC, the United Nations panel on climate that reviews the research. So the skeptics' own main author accepts the core of the science.

The real fight is at the edges. How hot do the models run? How much of each disaster should be blamed on CO2? Does fixing the problem cost more than the problem itself? On those edges the debate is still going, and this article does not name a winner.

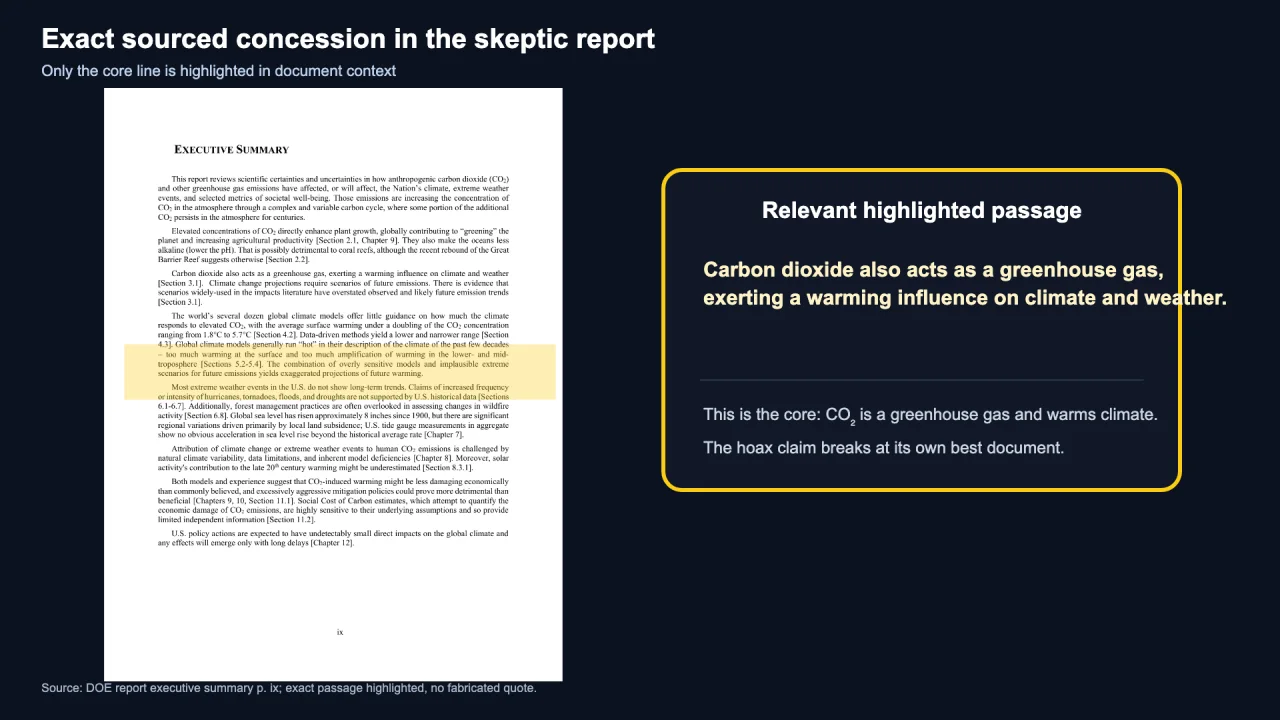
A highlighted line in the report's executive summary reading: carbon dioxide also acts as a greenhouse gas, exerting a warming influence on climate and weather.
The concession in the skeptics' own document, highlighted. This is the sentence a hoax claim cannot survive.From the Undastandable film.

The key thing to rememberEven the government's own skeptic report agrees with 95 percent of the mainstream science. The fight is about cost and how much, not whether.


💡 The idea you need for this part

Below, the article sorts everything into two piles. Settled: CO2 rose and people did it, the greenhouse effect is laboratory physics, the planet is warming, and people are the main cause. Even the DOE skeptics accept those points, and the UN climate panel calls the human role unequivocal, meaning there is no room for doubt. Still open: how much warming a doubling of CO2 brings, how much of one disaster to blame on climate, what each region will feel, and what the best policy costs. Then the article grades each side. The hoax claim fails, the doom claim goes too far, and the skeptics make fair points about models and cost.

↓  the part it explains is right below
🔍 Go deeper — the one idea to get first

What a doubling of CO2 means. Doubling means twice as much. Before industry, the air held about 280 parts per million of CO2, so a doubling means 560. In May 2026 the reading was 432. That is 152 more than 280, a little more than halfway to 560. Scientists agree that a doubling makes Earth warmer. What they argue about is how much warmer it ends up once everything settles. That answer comes back as a range, not one number, and it is one of the questions still open.

The Verdict

So what's settled — and what's still open?

Settled. Even the DOE skeptics accept these points. CO2 rose sharply, and people did it. The greenhouse effect is physics tested in laboratories. The planet is warming. People are the main cause.

The UN climate panel's word for the human role is “unequivocal.” That means it leaves no room for doubt. The four fingerprints are the reason.

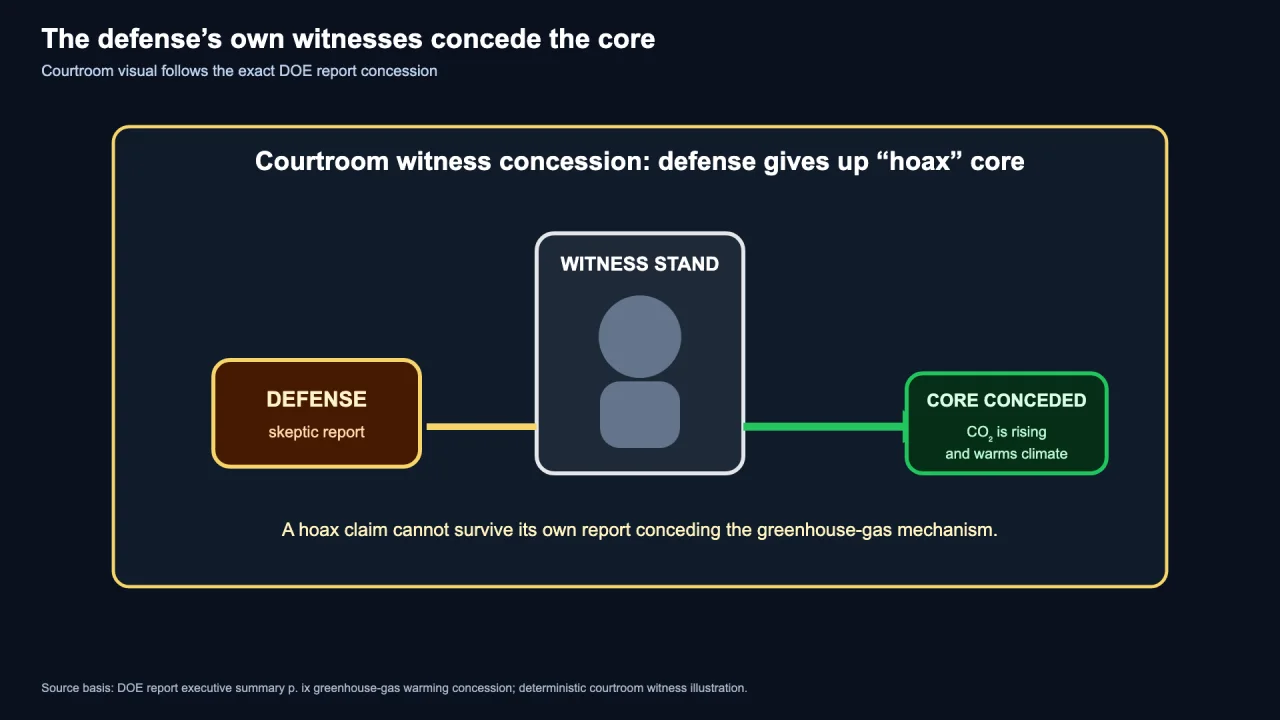
A courtroom diagram: the defense, labeled skeptic report, connects through a witness stand to a green box reading core conceded, CO2 is rising and warms climate.
The trial from the opening, finished: the defense's own witness gives up the core.From the Undastandable film.
Three dials labeled speed, severity and response cost, each with its needle at a different position.
What is genuinely still being argued: three dials, not the headline question.From the Undastandable film.

Still open. How much warming does a doubling of CO2 bring? How much of any single disaster should be blamed on it? What will specific regions feel, and when? And what does the smartest policy cost, compared with what it saves? Those are real arguments among real scientists.

Now grade both sides against that line. The hoax claim fails. It has to break four fingerprints that do not depend on each other, and it cannot break even one. The doom claim goes too far. It blames every bad storm on CO2, and the science does not support that. The skeptics make real points about models and costs. The mainstream holds the core.

That is the verdict. It is not a tie, and it is not the end of the world either.

The key thing to remember“Is it real, and is it us?” is settled. “How fast, how bad, and what to spend?” is the real fight.


💡 The idea you need for this part

Below, the article explains why the public feels split when the core science is this solid: money spent to shape what people believe, on both sides. On the doubt side, ExxonMobil's own scientists worked out the warming correctly starting in the late 1970s, and a 2023 review in the journal Science graded their predictions skillful. Documents gathered by Congress show the company then paid think tanks to make that science look unsettled. A think tank is a group that writes reports and speaks out on public issues. On the action side, the clean-energy industry has its own money riding on faster policy and bigger subsidies. A subsidy is a government payment or tax break. The article's test for any claim about cost: ask who profits if you believe it.

↓  the part it explains is right below
🔍 Go deeper — the one idea to get first

How to grade an old prediction. A projection is a forecast of what will happen if things keep going the way they are. You can grade one the way you would grade a weather forecast, only over decades instead of days. Take what the forecast said back then. Wait. Then compare it with what actually happened. If the two line up, the forecast was good. The first chart below does exactly this with ExxonMobil's own old projections.

The Money

Who has money riding on each answer?

If the core science is this solid, why does the public feel split? Part of the answer is money spent to shape belief. It flows in both directions, so both get named.

A page from the 2023 Science review beside a chart comparing ExxonMobil's own projections with the warming that was later observed.
The company's private projections, plotted against what actually happened. They were close.From the Undastandable film.

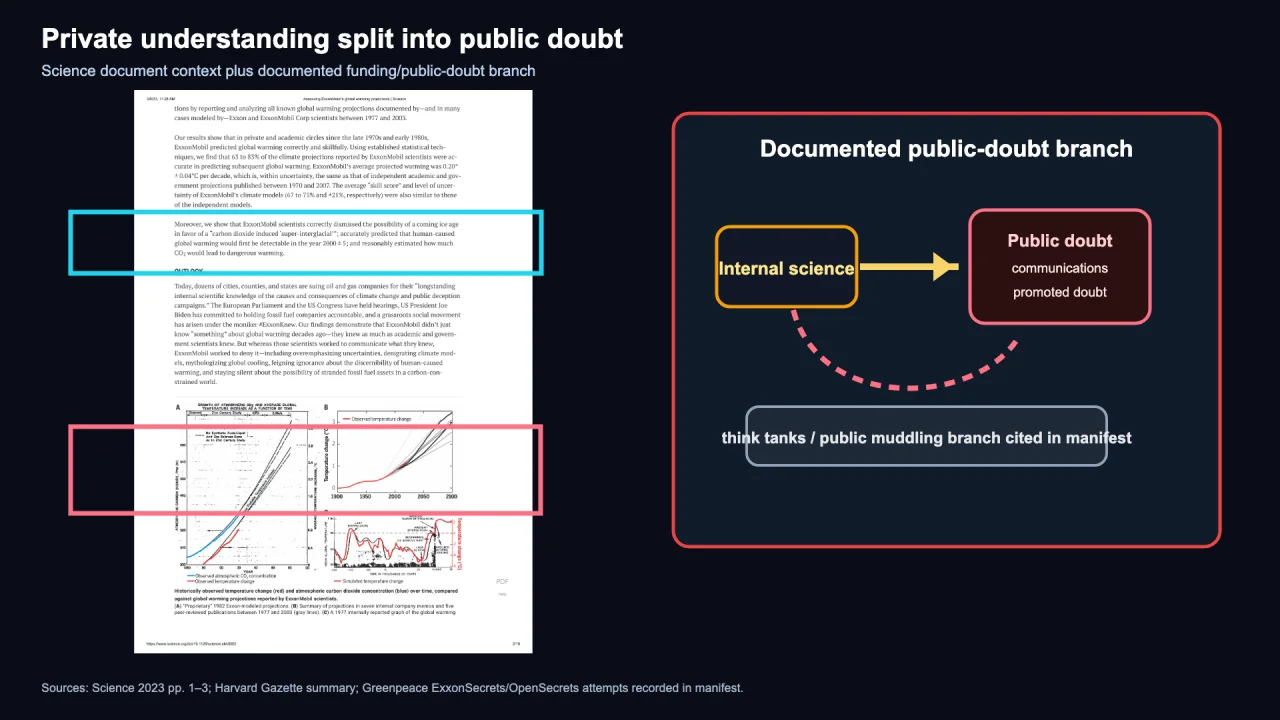
The proof on the doubt side. ExxonMobil's own scientists correctly worked out the warming people would cause, starting in the late 1970s. A 2023 review, checked by other scientists and printed in the journal Science, graded their old projections “skillful.” That means they got it right.

Documents gathered by Congress then show the company paying think tanks and allied groups, about $37 million since 1998 by one watchdog’s count. Those think tanks publicly made the same science look unsettled, the science the company had privately gotten right. It was a method borrowed from the tobacco playbook, the approach cigarette companies once used: pay to spread doubt about the science.

A page of the Science review beside a diagram showing internal science branching into public doubt through communications and funded think tanks.
Two branches from one company: what its scientists knew, and what its communications said.From the Undastandable film.
The official portrait of U.S. Energy Secretary Chris Wright beside a flow: gas industry career, then 17th Energy Secretary, then the commissioned DOE report.
The same test applied to the other document: who commissioned the skeptic report, and where he came from.From the Undastandable film.

What the action side stands to gain: clean energy is now a huge industry — wind, solar, batteries and electric cars. It has its own real interest in faster policy and bigger subsidies. Some of its supporters oversell how sure the science is, or blame single disasters on climate, to build momentum.

Naming the money is not taking a side. It is the fact the shouting leaves out. And it gives you a way to judge any claim about cost: ask who profits if you believe it.

The key thing to rememberBoth sides have billions riding on what you believe. Judge every claim knowing who benefits.


💡 The idea you need for this part

Below, the article splits climate numbers into two kinds. First come measurements, things that already happened: 2024 was the warmest year measured, the sea is up about eight inches in a century, and Greenland and Antarctica are losing billions of tons of ice every year. Then come projections, forecasts for the year 2100 that depend on what countries do. Before the Paris agreement, a worldwide deal to cut emissions, the forecast was about 3.6 degrees Celsius of warming. Celsius is the temperature scale most of the world uses. Under the policies in place today, it is about 2.6, and about 1.9 if countries meet their targets. The forecast came down because new policies and cheap renewable power moved it.

↓  the part it explains is right below
🔍 Go deeper — the one idea to get first

Why a forecast comes as a range. A projection is a forecast with an “if” attached. Think about a 300-mile car trip. If you drive 60 miles an hour, it takes 5 hours. If traffic slows you to 50, it takes 6. Nobody can give one exact arrival time, because it depends on what happens on the road, so the answer is a range: 5 to 6 hours. Climate projections work the same way. The warming by 2100 depends on the choices countries make, so each set of choices gets its own range. When countries change their plans, the forecast changes with them. That is how it came down from about 3.6 degrees to about 2.6.

The Numbers

What's already measured — and where is it heading?

The measurements so far. 2024 was the warmest year ever measured, and 2025 was the third-warmest. That comes from Copernicus, Europe's climate monitoring service.

Sea level is up about eight inches over the last century. Satellites measure it from above, and tide gauges measure it along the coast. A tide gauge is an instrument that tracks how high the water stands.

Greenland has been losing around 280 billion tons of ice a year. Antarctica has been losing about 150 billion.

before Paris policies in place today if targets are met 3.6°C 2.6°C 1.9°C Projected warming by 2100. These are ranges, and the range came down.
Projections, not measurements — stated as ranges. Before Paris the projection was about 3.6 degrees; Climate Action Tracker’s November 2025 update puts current policy near 2.6.

The road ahead. These numbers are ranges, because that is what they are. Before the Paris agreement, experts projected around 3.6 degrees Celsius of warming by 2100.

Climate Action Tracker is an independent group that tracks countries' climate plans. Its November 2025 update projects about 2.6 degrees under the policies actually in place today, and around 1.9 degrees if countries hit the targets they have announced.

That is still too high, and nobody knows the exact number. But the direction moved, because policy and cheap renewable power moved it. Renewable power comes from sources that do not run out, like sunshine. Renewables now supply more than 30 percent of the world's electricity.

The key thing to rememberThe measurements are what already happened. The projections are ranges, and the range has come down as the world acted.


💡 The idea you need for this part

Below, the article looks at people instead of physics. The question is what fear does to the way people act. Two researchers answer it. Sander van der Linden, a professor at Cambridge, studies persuasion, which is how people get talked into believing or doing something. Friederike Otto is a climate scientist who reports what the people she talks to feel. What they describe works like a hill, and the picture in this part draws it. A little fear pushes people to act. Past the top of the hill, more fear makes them stop trying. That is why the article says the calm way of explaining climate works better than panic.

↓  the part it explains is right below

The Backfire

Why does the doom version backfire?

This finding annoys both sides. The panic version of climate change does more than overstate the science. It puts people off doing anything.

Sander van der Linden, a professor at Cambridge who studies persuasion, describes the pattern. Some fear spurs action. Too much fear tips people into avoidance and giving up. If it's hopeless, why try?

The climate scientist Friederike Otto says the people she talks to are plenty scared. They are just not scared into doing anything.

how much people act a little fear helps too much fear shuts people down how frightened people are
The pattern the persuasion researchers describe: a little fear moves people, and past a point it stops them.

So the calm version you have just gone through is not only more accurate. It is also more useful.

The key thing to rememberToo much fear makes people freeze up instead of act. The researchers who study persuasion say so.


💡 The idea you need for this part

Below, the article ends the practical side with two small jobs, each a few minutes long. The first is about your insurance bill, the place climate change is most likely to reach you. It uses a hazard map, a free public map from your county that shows how likely each address is to flood or to burn in a wildfire. The second is about your own judgment: opening one public number yourself, from NOAA or Copernicus, instead of trusting what someone says it is.

↓  the part it explains is right below

Tonight

What can you actually do about it — tonight?

Two moves. Both are proven. Neither needs panic.

1. Defend your wallet Check the address on your county flood and wildfire hazard map. Shop coverage early. 2. Check one number Open NOAA’s daily Mauna Loa CO2 reading, or Copernicus’ yearly temperature ranking.
Both moves take minutes and neither requires panic.

Protect your own wallet first. The version of climate change most likely to reach you is an insurance bill. Before you buy, renew or move, check the address's flood and wildfire risk on your county's hazard map. It is a free public map your county government publishes. Then shop for insurance early. That is the chain from earlier, ending at your mailbox, and it is protection you control now.

Check one number yourself. It takes two minutes. NOAA publishes the daily Mauna Loa CO2 reading. Copernicus publishes the yearly temperature ranking. Open either one. Once you have checked a number with your own eyes, “they say” turns into “I checked.” Then a shouting headline from either side has less power over you.

The key thing to rememberCheck your insurance risk, and check one number yourself. Both take minutes.


💡 The idea you need for this part

Below, the article ends on a true story about a problem over the whole planet, and how the world fixed it. The story is about the ozone layer, a thin layer of gas high in the sky that works like sunscreen for the planet. In the 1980s, a hole was opening in it. The story moves in four steps. Scientists measured the damage. Companies argued that fixing it would hurt business. Countries signed a promise in 1987 called the Montreal Protocol. And the hole began to heal. The article then puts that story next to climate.

↓  the part it explains is right below

The Precedent

Has anything this big ever been fixed before?

Yes. In the 1980s, scientists found that chemicals used in refrigerators and spray cans were opening a hole in the ozone layer. Ozone is a gas. The ozone layer is the part of the sky that blocks the sun's most harmful rays.

Companies said fixing it would be a disaster for business. The world signed the Montreal Protocol in 1987 anyway. The Montreal Protocol is a treaty, a written agreement that countries sign and promise to follow. The chemicals were swapped out for others. The ozone layer is now measurably healing, and it is on track to recover this century.

1987 2005 today The dark patch is the hole in the ozone layer. It is measurably closing.
The precedent: a sky-sized problem that was measured, argued about, acted on in 1987, and is now healing.

It was a problem over the whole planet. It was measured, argued about, acted on and fixed, while doubters said it couldn't be done. Climate is a bigger job. It is not a different kind of job. And because climate changes over decades, there is time to do it carefully.

The key thing to rememberThe world has already fixed one planet-wide problem. The steps for doing it are known.


💡 The idea you need for this part

Below, the article points to another Undastandable explainer that picks up a thread from this one: the AI data-center land rush, about the electricity new AI computer buildings need. After that comes a short list of every organization named in the article, such as NASA, NOAA, Copernicus and the IPCC, and what each one is.

↓  the part it explains is right below

The Threads

Where does this story connect?

Another of our explainers picks up a thread that starts here: the AI data-center land rush. It is about the electricity that new AI computer buildings need, running into the power grid people are trying to clean up.

Every number in this article comes from a named source: the consensus studies, the Mauna Loa measurements, the satellite measurements, the temperature rankings, the disaster count, the insurance figures and the projections. The organizations: NASA is the U.S. space agency and runs satellites that watch Earth. NOAA is the U.S. weather and ocean agency and runs Mauna Loa. Copernicus is Europe's climate monitoring service. The IPCC is the United Nations panel that reviews the research. Climate Action Tracker makes independent projections. The 2025 DOE report is the skeptic voice, labeled as that. Don't take our word for anything. That's the whole point.

Don’t take our word for it — all 50 sources, with their links

Primary sources first where there is one. Each link is labeled with what kind of source it is. Live figures (the CO2 reading, the temperature ranking, the renewables share) update, so check the date on the page.

The Question

Climate change: real or hoax?

You've heard it called the end of the world. You've heard it called a scam. Both can't be true. So let's examine it the way a trial would: the evidence gets presented, then countered, and you see all of it.

Start with where the scientists themselves landed. In 2013, a team led by John Cook read the summaries of about twelve thousand peer-reviewed climate papers. Of the papers that took a position, about ninety-seven in a hundred said the warming is real and we're causing it. In 2021, a team led by Mark Lynas ran the test again on three thousand newer papers pulled from a pool of eighty-eight thousand. Agreement had climbed past ninety-nine in a hundred. NASA and every major national academy of sciences say the same thing.
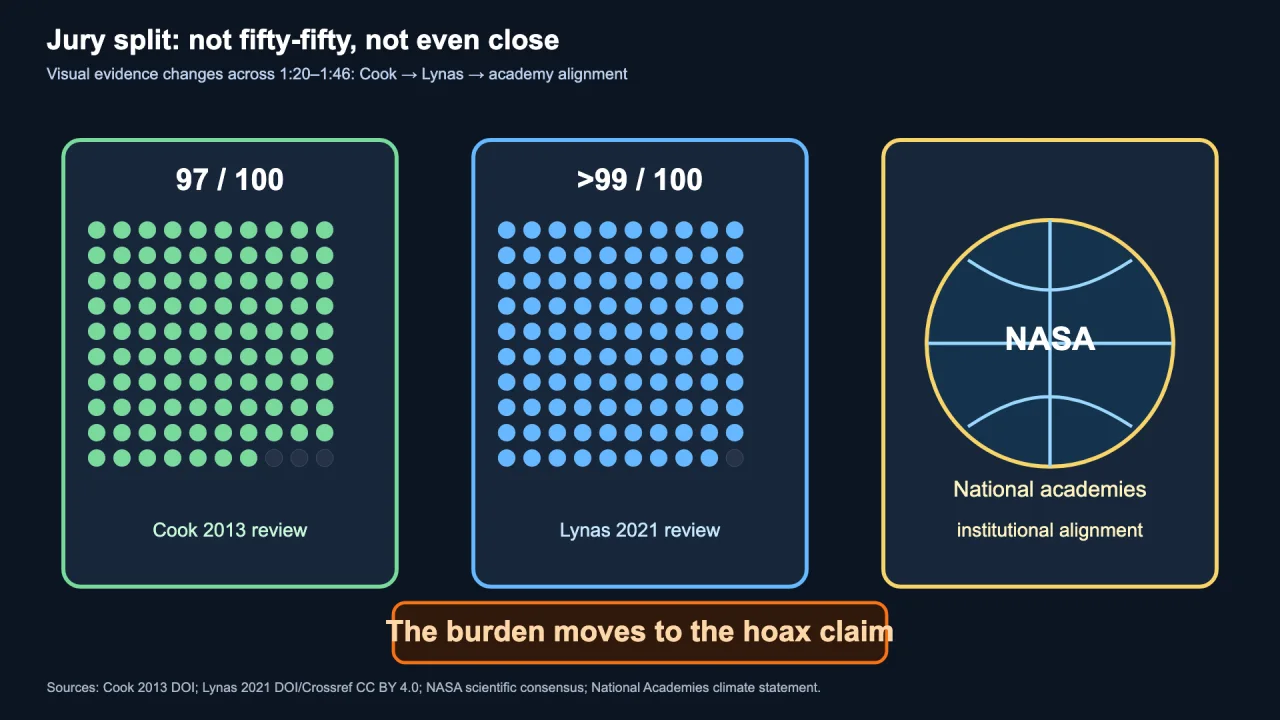
Three panels: a 97-out-of-100 dot field labeled Cook 2013, a greater-than-99-out-of-100 dot field labeled Lynas 2021, and a NASA globe labeled national academies.
Two counts of the published research, taken eight years apart, plus the institutions. The dark dots are the papers that disagreed.From the Undastandable film.

When the evidence is that lopsided, it walks into court as established fact. The burden of proof sits on the hoax claim — and doubt alone doesn't win. It has to break the evidence. Hold that standard. The rest of this article is that test, run in front of you.

And the skeptics get a real hearing. In July 2025, the U.S. Department of Energy published a review by five credentialed skeptical scientists arguing the alarm is overstated. They land some fair punches, and you'll see each one graded below. You'll also see where that report came from — because where a case comes from is evidence too.
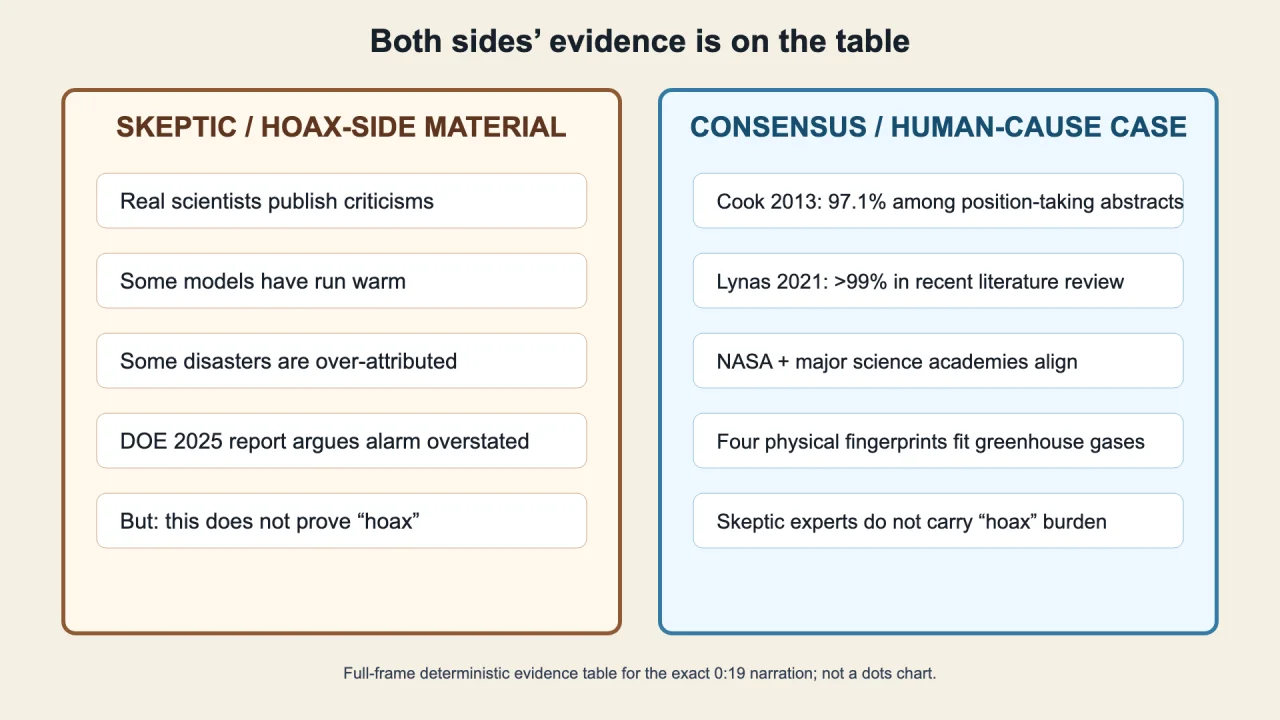
Two columns side by side: the skeptic side's material on the left, the consensus side's material on the right.
Both sides' material, laid out before either gets graded.From the Undastandable film.

The key thing to rememberAmong the scientists who study this, agreement is about 99 to 1. From here on, the hoax side has to break the evidence, not just doubt it.


The Definition

What does "climate change" actually mean?

Most coverage never defines it. Global warming is the thermometer reading — Earth's average temperature going up. Climate change is everything that extra heat then pushes on: the oceans, the ice, the rainfall, the storms, the growing seasons.
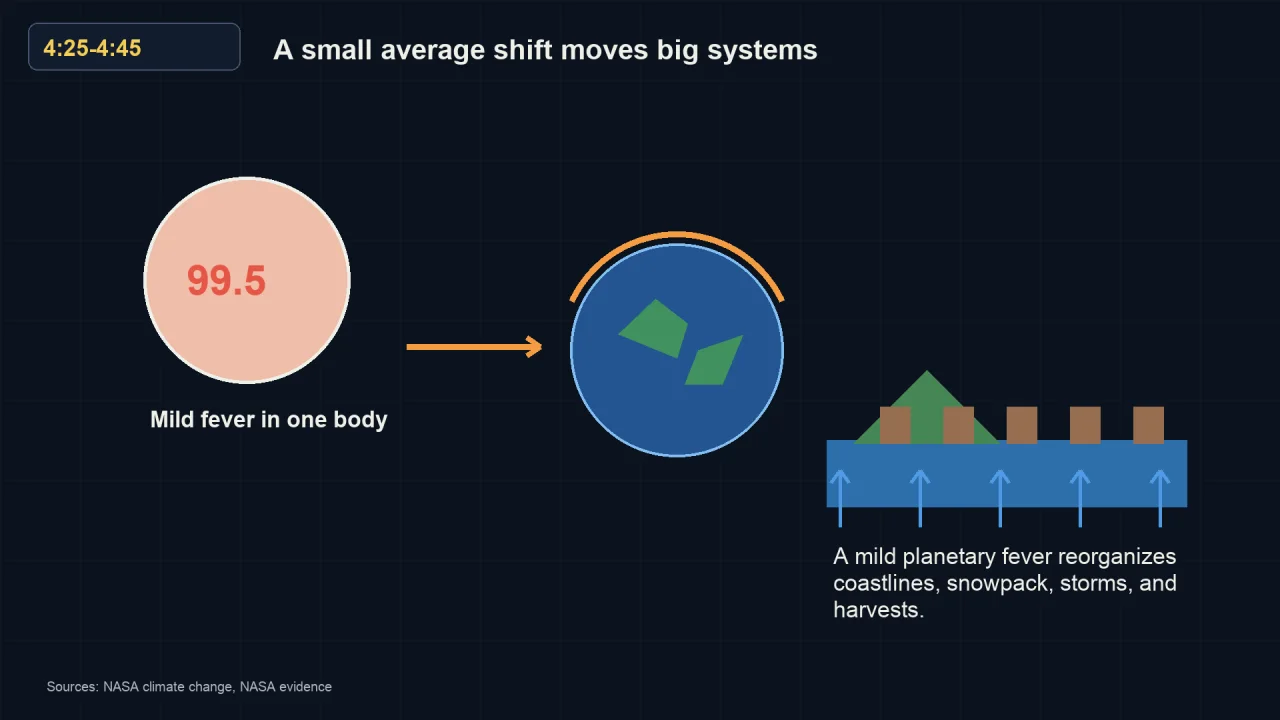
A thermometer reading 99.5 beside a warming Earth, and beside that a row of houses with the sea rising into them.
A mild fever in one body is nothing. The same mild fever in a planet moves the coastline.From the Undastandable film.

A person running a small fever isn't very sick. A planet running a small fever reorganizes its coastlines. That's why a couple of degrees — which sounds like nothing — ends up moving your rain, your snowpack, and your grocery bill.

The key thing to rememberWarming is the temperature. Climate change is everything the extra heat does.


The Building Block

What is CO2, and how much did we add?

CO2 — carbon dioxide — is an invisible gas that's always been in the air. Plants use it. At outdoor levels it isn't poisonous. The problem was never that it exists. The problem is how much we added, and how fast.

Before the industrial era, the air held about 280 CO2 molecules per million molecules of air — 280 "parts per million." Since 1958, instruments on the Mauna Loa volcano in Hawaii have measured it directly, every single day. In May 2026 the reading hit 432 parts per million — another record, up more than fifty percent, the highest level in millions of years. Most of the extra came from burning coal, oil, and gas; most of the rest from clearing the forests that used to soak carbon back up.

280 ppm — the air before industry 432 ppm — May 2026 1750 1958 — daily measuring starts today Thousands of years to move it before. About 150 years to move it now.
The air held about 280 parts per million for the whole of human history before industry. Since 1958 an instrument on Mauna Loa has read it every day; in May 2026 it read 432.

And the speed is the story. NASA calculates today's CO2 is climbing about 250 times faster than it did coming out of the last ice age. Nature took thousands of years to move it that much. We did it in about 150 years of industry.

The key thing to rememberFor every two CO2 molecules in the air in 1750, there are three now — and we know because we've measured it daily since 1958.


The Mechanism

Why does CO2 trap heat in the first place?

Fair question — how does an invisible trace gas warm a planet? The greenhouse effect is normal, and you need it: without it, Earth would be frozen. Sunlight comes in and warms the ground. The ground sends heat back out as infrared. CO2 catches part of that outgoing heat and sends some of it back down instead of letting it escape to space. More CO2, more heat kept.
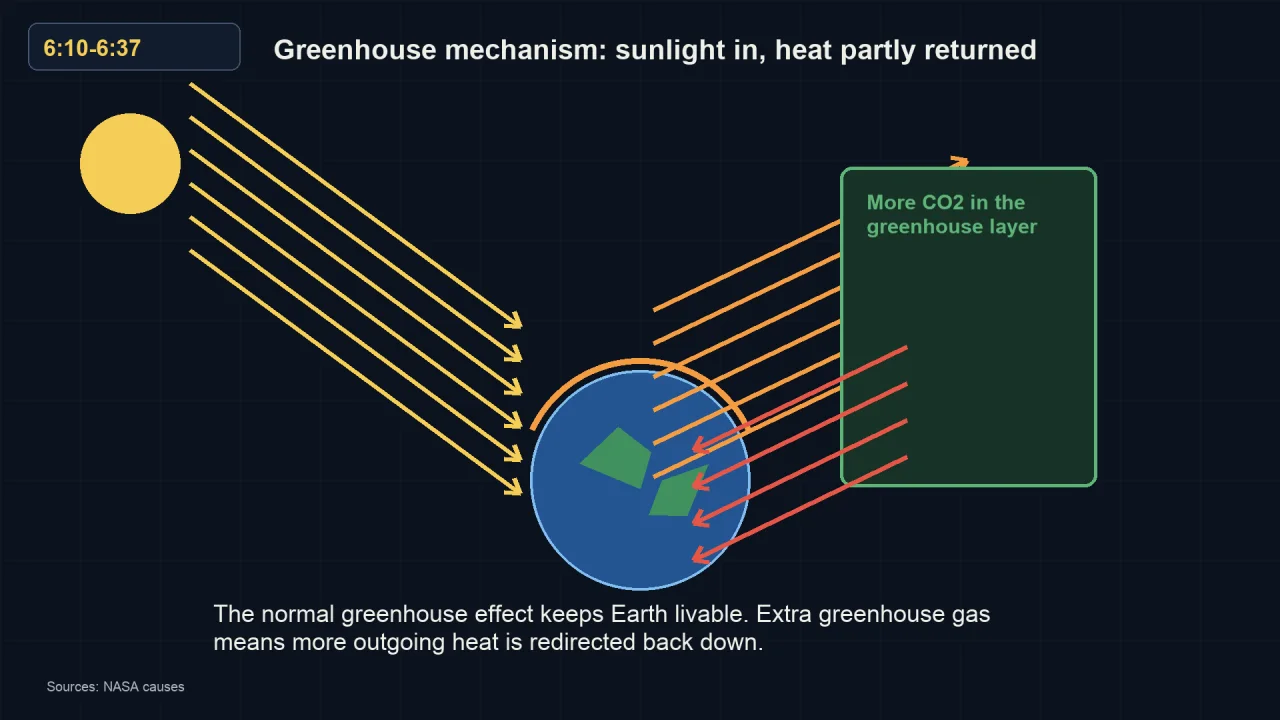
Sunlight arrives at Earth from the sun; outgoing heat leaves the surface, meets a green greenhouse layer, and part of it is turned back down toward Earth.
Sunlight in, heat out — except the thicker the greenhouse layer, the more of that outgoing heat gets turned back down.From the Undastandable film.

This isn't a new idea, and it isn't a computer model. Scientists demonstrated CO2's heat-trapping in a lab in the 1850s. And we've photographed it from space: a NASA satellite recorded Earth's outgoing heat in 1970, another repeated the exact measurement in 1997, and researchers writing in the journal Nature in 2001 found less heat escaping in precisely the wavelength bands where CO2 does its blocking. Newer satellites keep finding the same thing. That's the greenhouse effect, caught on camera from orbit — twice, decades apart.

The key thing to rememberCO2 trapping heat is 170-year-old lab physics, and satellites have photographed it happening.


The Distinction

Why doesn't a cold winter settle anything?

One distinction defuses most climate headlines from both directions: weather is not climate.
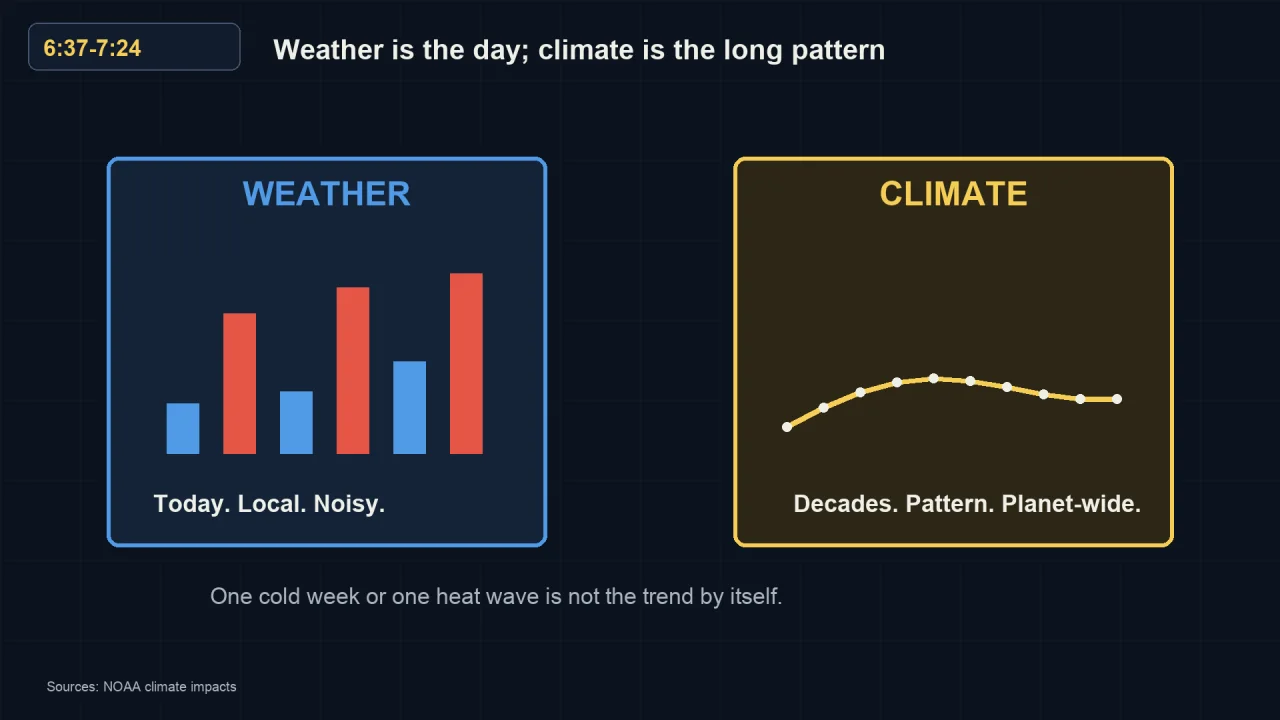
Left panel: jumpy blue and red bars labeled weather, today, local, noisy. Right panel: one smooth line labeled climate, decades, pattern, planet-wide.
Same planet, two different questions: the jumpy bars on the left, the long line on the right.From the Undastandable film.

Weather is today, this week, one town — and it swings on its own. Climate is the pattern over decades, measured across the whole planet. So "it snowed this week, warming's fake" and "hottest day ever, we're doomed" are the same mistake: one region's short-term weather passed off as the planet's long-term trend.

UK meteorologist Jim Dale puts it cleanly: a wildfire starts with a match or an arsonist — that's ignition. But the heat, the drought, and the wind decide how bad it gets — that's the climate underneath. Two different questions. Each side keeps only the half it likes.
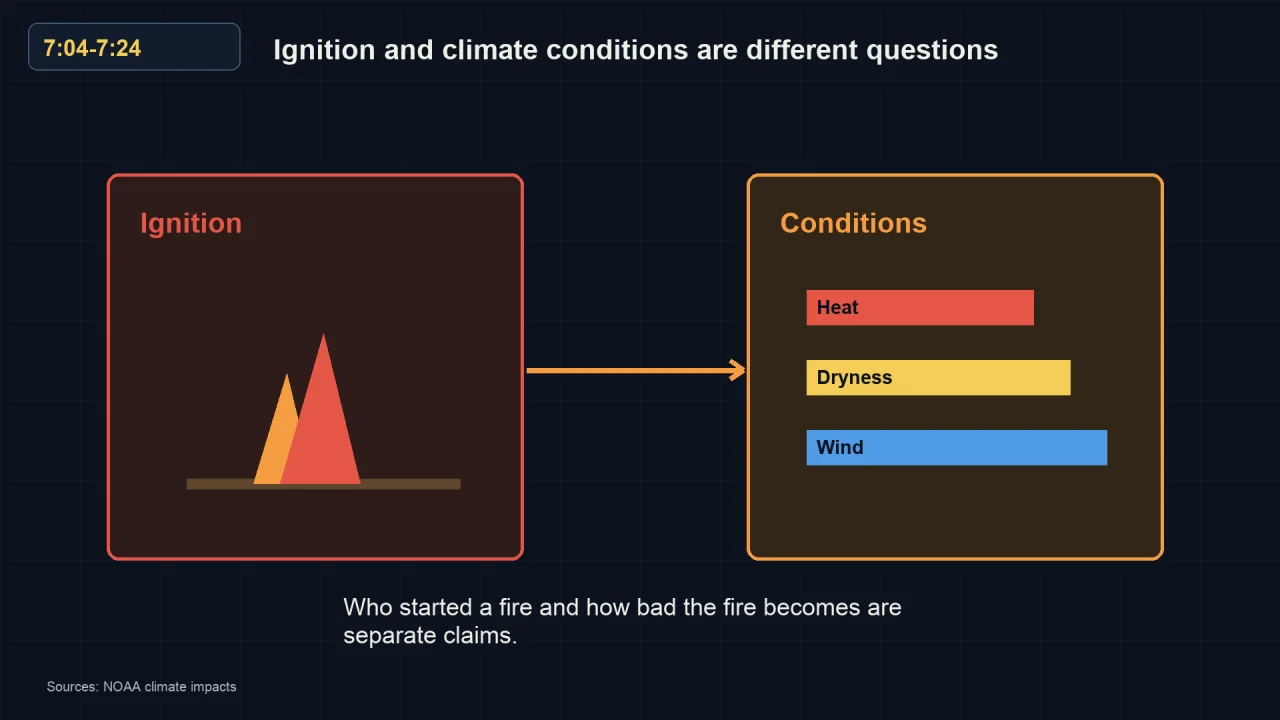
Left box labeled ignition shows a small flame. Right box labeled conditions shows three bars: heat, dryness, wind.
Who lit it, and how bad it got, are two separate claims.From the Undastandable film.

The key thing to rememberOne cold week can't erase a fifty-year global trend — and one hot week can't prove it.


The Ancient Record

How can anyone know the CO2 level from 800,000 years ago?

A fair skeptic's objection: nobody had instruments back then, so those ancient numbers can't be trusted. Except they can be checked — and that's the difference.

You've seen layers like this yourself — the striped bands on a road cut or the side of a mountain, each stripe a different age of rock laid down in order. Ice does the same thing. Snow falls in Antarctica, packs into ice, and each year's layer seals in tiny bubbles of the actual air that was blowing when it fell. Drill a core two miles deep and you're holding dated samples of ancient atmosphere — real air, not a guess — going back 800,000 years. Scientists date the layers the same way you'd count tree rings, and different labs on different continents get the same numbers from different cores.

Each stripe is one year’s snow. Sealed inside it: bubbles of the real air that was blowing then. Drill two miles down and you hold 800,000 dated years. the ice core the two records meet Ancient bubbles and modern sensors overlap in the same years — and agree.
Each year of Antarctic snow seals real air inside it. Drilling down is reading back through dated samples of the actual atmosphere.

Across that entire record, through ice ages and warm spells, CO2 never once crossed roughly 300 parts per million. Today it's 432. And the check that answers "it can't be right": the ice-core record and the daily Mauna Loa instrument record overlap in the modern era — and they agree. Two completely independent methods, ancient bubbles and modern sensors, drawing one continuous line. For the skeptic to be right, both would have to be wrong, separately, in the same direction.

The key thing to rememberAncient ice and modern instruments are two independent records — and they draw one line.


The Lockdown Test

If the COVID shutdowns cleared the skies, why did CO2 keep climbing?

During the 2020 lockdowns, skies visibly cleared, and a lot of people concluded the problem fixes itself the moment we ease off. But that visible pollution — smog, soot — is a different substance from CO2. Smog washes out of the air in days. CO2 accumulates.

the faucet: burning coal, oil and gas the tub: CO2 already in the air the drain: forests and oceans, and it is the smaller pipe
The 2020 lockdowns turned the faucet down about 5.4 percent for one year. The level in the tub kept rising, because a smaller pour is not a drain.

Picture a bathtub. Burning fuel is the faucet. Forests and oceans are the drain, and the drain is smaller than the faucet. NASA's Jet Propulsion Laboratory measured the lockdown emissions cut at about 5.4 percent for 2020 — the biggest sudden cut ever — and the CO2 level in the sky kept rising anyway, because turning the faucet down a little doesn't drain the tub. Meanwhile deforestation keeps shrinking the drain.

The key thing to rememberSlowing how fast you fill the tub is not the same as draining it.


The Fingerprints

How do we know it's us — and not the sun?

This is the strongest fair skeptical question, and "trust the experts" is not an answer. The skeptic's premise is true: Earth's climate has changed many times without us — orbital wobbles, solar swings, volcanoes. So how do scientists tell today's warming from a natural one?

Fingerprints. Different causes leave different measurable patterns, so you don't have to argue about it — you can check. There are four, from four separate kinds of instruments run by separate teams.

One: the split. If a hotter sun were doing this, the whole atmosphere would warm together, top to bottom, like a room with a stronger heater. That is not what's happening. The surface is warming while the stratosphere — the layer above the CO2 blanket — is cooling, because the blanket traps heat below and starves the layer above. And how would anyone measure the temperature that high up? Weather balloons have carried thermometers into the stratosphere for decades, and satellites have measured it from above since the 1970s — two separate instrument records. Scientists predicted this exact split in 1967, before the satellites existed to confirm it. A 2023 study led by climate scientist Benjamin Santer measured one to two degrees of stratospheric cooling between 1986 and 2022 while the surface warmed, and called the combined human fingerprint incontrovertible.

STRATOSPHERE the layer above the blanket it is cooling TROPOSPHERE the air you breathe it is warming A brighter sun would warm both bands together. This is not that.
The measured pattern: the air near the ground warming while the layer above it cools. Weather balloons and satellites, two separate instrument records, both show it.

Two: the carbon's signature. Carbon comes in slightly different atomic "flavors," and fossil-fuel carbon is missing certain ones. As CO2 rose, the mix in the air shifted toward exactly the fossil-fuel signature. A volcano or the ocean can't fake that — their carbon carries different flavors, and labs can tell them apart.
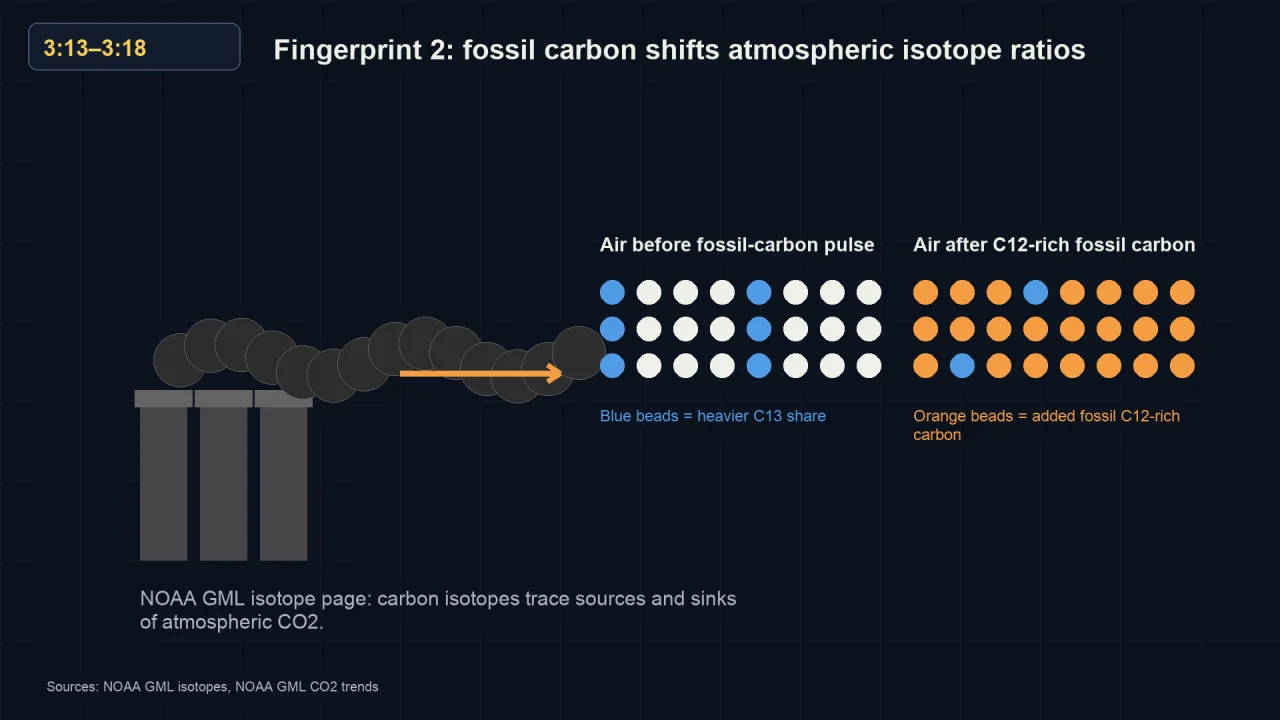
Two grids of beads. The left grid, air before the fossil-carbon pulse, has scattered blue beads. The right grid, air afterwards, is mostly orange.
The mix of carbon "flavors" in the air shifts toward the fossil-fuel signature as CO2 climbs.From the Undastandable film.

Three: the photograph. The satellite measurements you already met — less heat escaping to space in exactly CO2's bands, recorded in 1970 and again decades later.
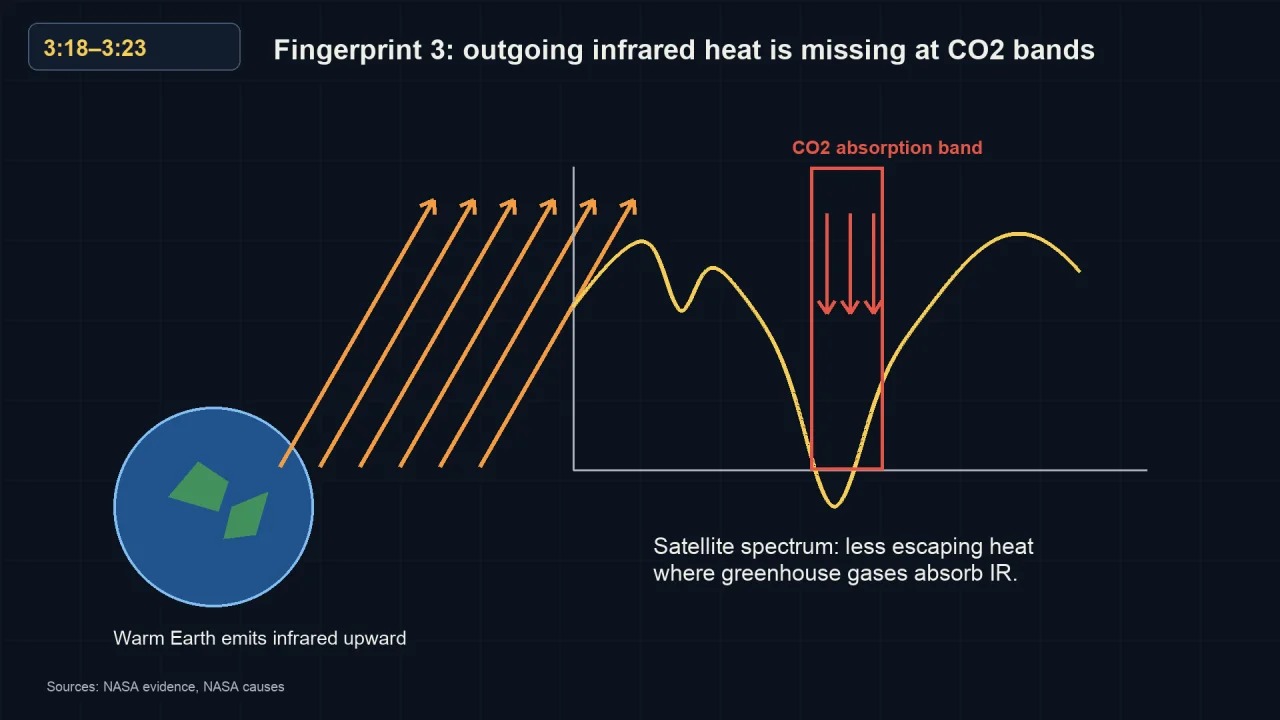
Earth emits infrared upward; a spectrum curve beside it shows a deep notch marked as the CO2 absorption band.
Measured from orbit: the outgoing heat has a bite taken out of it, exactly where CO2 absorbs.From the Undastandable film.

Four: the nights. A heat-trapping blanket works around the clock, so nights warm faster than days. A brighter sun would do the opposite. Thermometers worldwide show nights winning.

Daytime warming Night-time warming A blanket works all night. A brighter sun would do the opposite.
Thermometers worldwide show night-time warming outpacing daytime warming — the signature of held-in heat, not of a stronger sun.

Four fingerprints. Four independent methods. All pointing the same way. For "it's natural" to be right, all four would have to be wrong — separately, at the same time, in the same direction. That's why covering it multiple ways matters: each one is checkable, and together they're nearly impossible to deny.

One caveat, stated plainly: these fingerprints prove humans drive the overall trend. They do not prove any single storm or fire was "caused by" climate change — that's a separate, harder science, and mixing the two up is the most common error on both sides.

The key thing to rememberFour independent measurements — the split, the carbon signature, the space photograph, the nights — all point at us.


The Cascade

How does a far-off average land on your bill?

This part isn't abstract, because it's already in your mailbox. Follow the chain — every link is a measured number.

We burn fuel measured since 1958 More heat is held 11 warmest years Disasters cost more now about every 2 weeks Insurers reprice your premium Every link in that chain is a measured number.
The path from a fuel receipt to your renewal notice. No step in it is an opinion.

We burn fuel, measured daily since 1958. The air holds more heat — 2015 through 2025 were the eleven warmest years ever recorded, per the World Meteorological Organization. Hotter, drier conditions make disasters more expensive: in the 1980s, the United States averaged a billion-dollar disaster about every four months; now it's roughly every two weeks. (NOAA kept that tally from 1980 until it was retired in May 2025 — and Climate Central relaunched it in October 2025 with the same peer-reviewed method and the same lead scientist, so the count survives.)
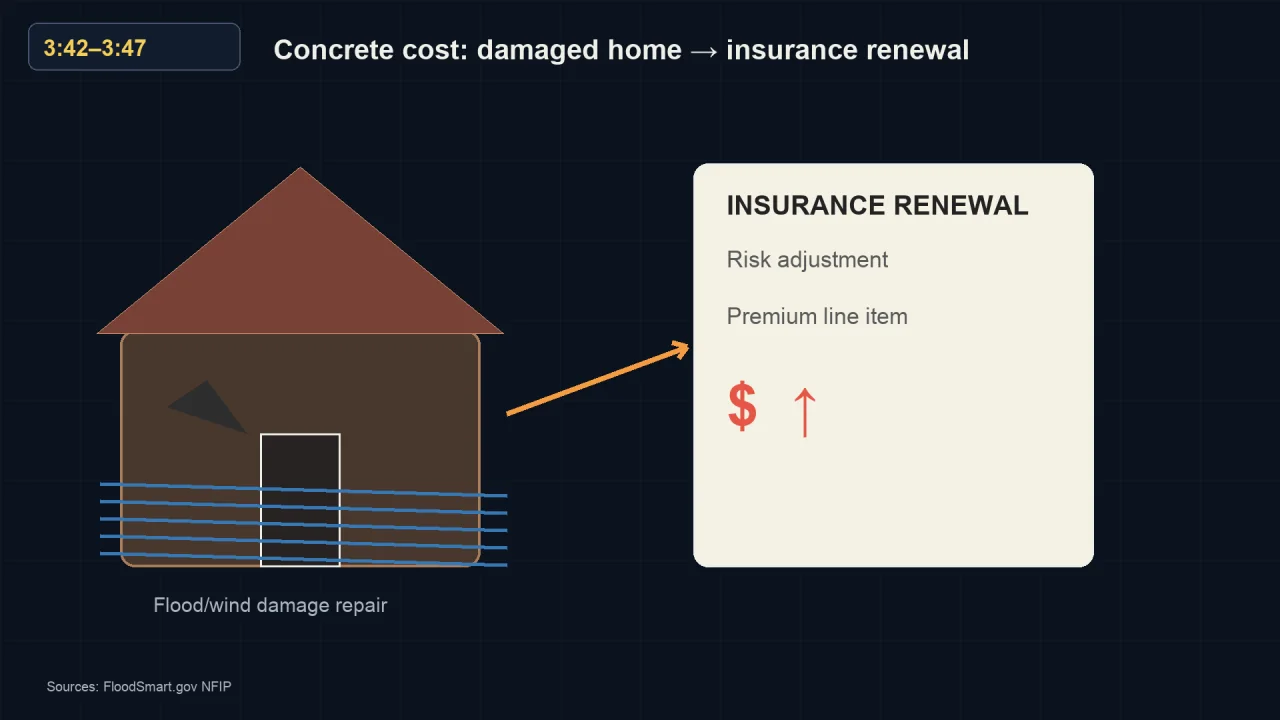
A house with floodwater across its lower half, an arrow leading to an insurance renewal notice with a rising dollar figure.
Where the chain ends for most people: the renewal notice, repriced for the new map.From the Undastandable film.

Insurers read those numbers, and they don't argue politics — they reprice. Property insurance is up nearly seventy percent in five years, and in some regions companies have stopped writing policies at all. Not all of that rise is weather: ICE says higher home values, and the higher cost of rebuilding them, are part of it. But disaster risk is the part that keeps climbing, and it is why some insurers are leaving. Nobody asked for your vote on that premium. It arrived priced for the new map.

The debate reaches your kitchen table as a bill whether you follow the science or not.

The key thing to rememberBurning fuel traps more heat, trapped heat makes disasters pricier, and pricier disasters land on your insurance bill. Every link is measured.


The Real Argument

What are real scientists actually fighting about?

Not what the shouting suggests. The genuine disagreement, with everyone named and labeled:
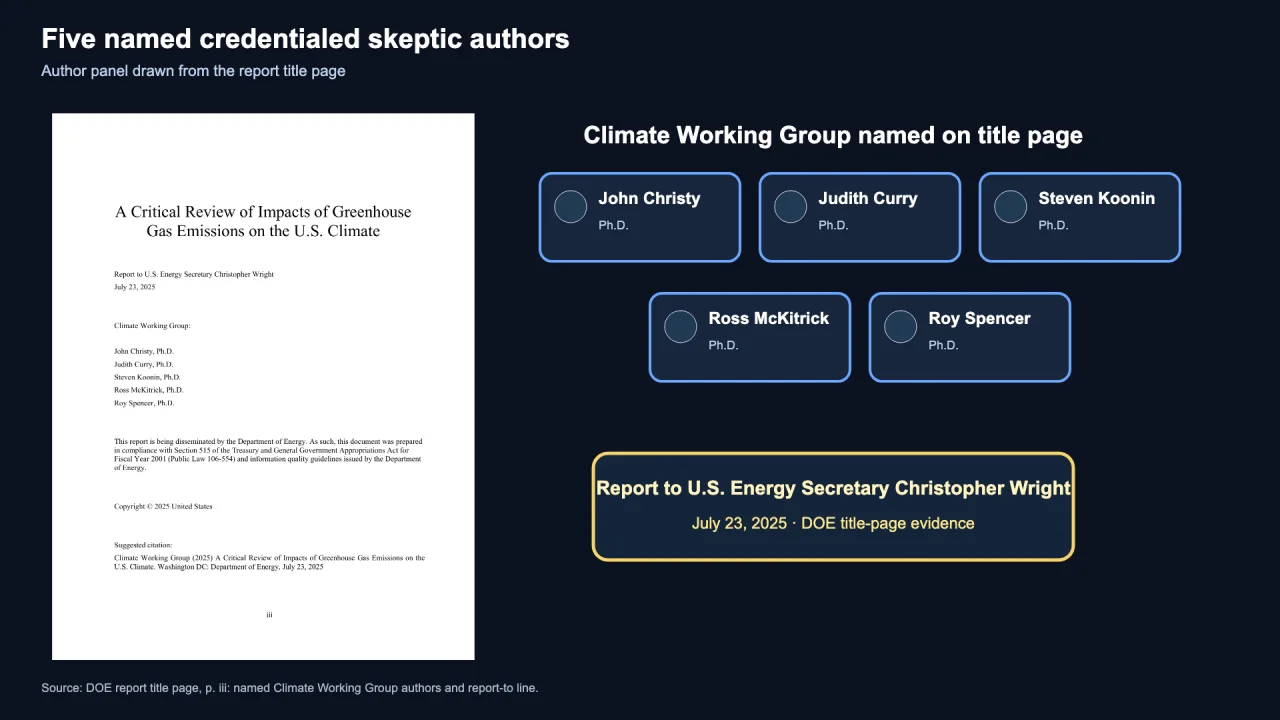
The Department of Energy report's title page beside five named author cards: John Christy, Judith Curry, Steven Koonin, Ross McKitrick and Roy Spencer.
The skeptic side, named and credentialed, from the report's own title page.From the Undastandable film.

The skeptical side: the July 2025 Department of Energy review was written by five scientists with real credentials — Judith Curry, Roy Spencer, John Christy, Ross McKitrick, and Steven Koonin — assembled by Energy Secretary Chris Wright, who previously ran a gas company. Their actual claims come down to three: climate models tend to run a bit hot, most types of extreme weather don't yet show a clear trend, and aggressive net-zero policy could cost more than it saves. They also make a point usually left out: extra CO2 has genuinely boosted plant growth in places.

The mainstream reply: more than eighty-five scientists signed a rebuttal, reported by NPR, saying the report cherry-picks and misrepresents the field.

Then Koonin himself said on air that ninety-five percent of their report agrees with or is drawn from the UN's climate panel. The skeptics' own lead author concedes the core. The real fight is at the edges — how hot the models run, how much of each disaster to pin on CO2, whether the cure costs more than the disease. On those edges the debate is genuinely live, and nobody here crowns a winner.

The key thing to rememberEven the government's own skeptic report agrees with 95% of the mainstream science. The fight is about cost and degree, not whether.


The Verdict

So what's settled — and what's still open?

Settled, conceded even by the DOE skeptics: CO2 rose sharply and we did it; the greenhouse effect is lab-tested physics; the planet is warming; humans are the main cause. The UN panel's word for the human role is "unequivocal," and the four fingerprints are why.
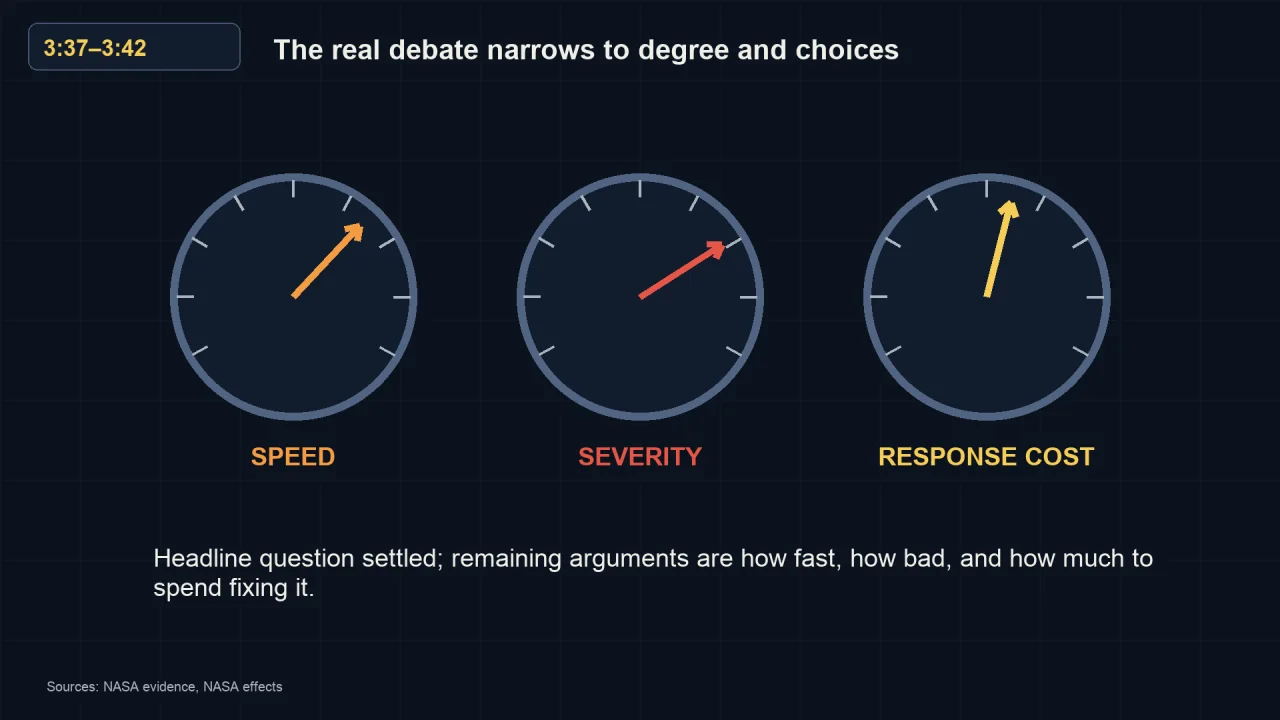
Three dials labeled speed, severity and response cost, each with its needle at a different position.
What's left to argue: three dials, not the headline question.From the Undastandable film.

Still open: exactly how much warming a doubling of CO2 delivers; how much of any single disaster to attribute; what specific regions feel, and when; and what the smartest policy response costs versus saves. Those are real arguments among real scientists.

Grading both sides against that line: the hoax claim fails — it has to break four independent fingerprints and can't break one. The doom claim overreaches — it pins every bad storm on CO2, which the science doesn't support. The skeptics land real punches on models and costs; the mainstream holds the core. That's the verdict: not a tie, and not an apocalypse either.

The key thing to remember"Is it real and is it us" is settled. "How fast, how bad, what to spend" is the real fight.


The Money

Who has money riding on each answer?

If the core science is this solid, why does the public feel split? Partly: money spent shaping belief — in both directions, so let's name both.
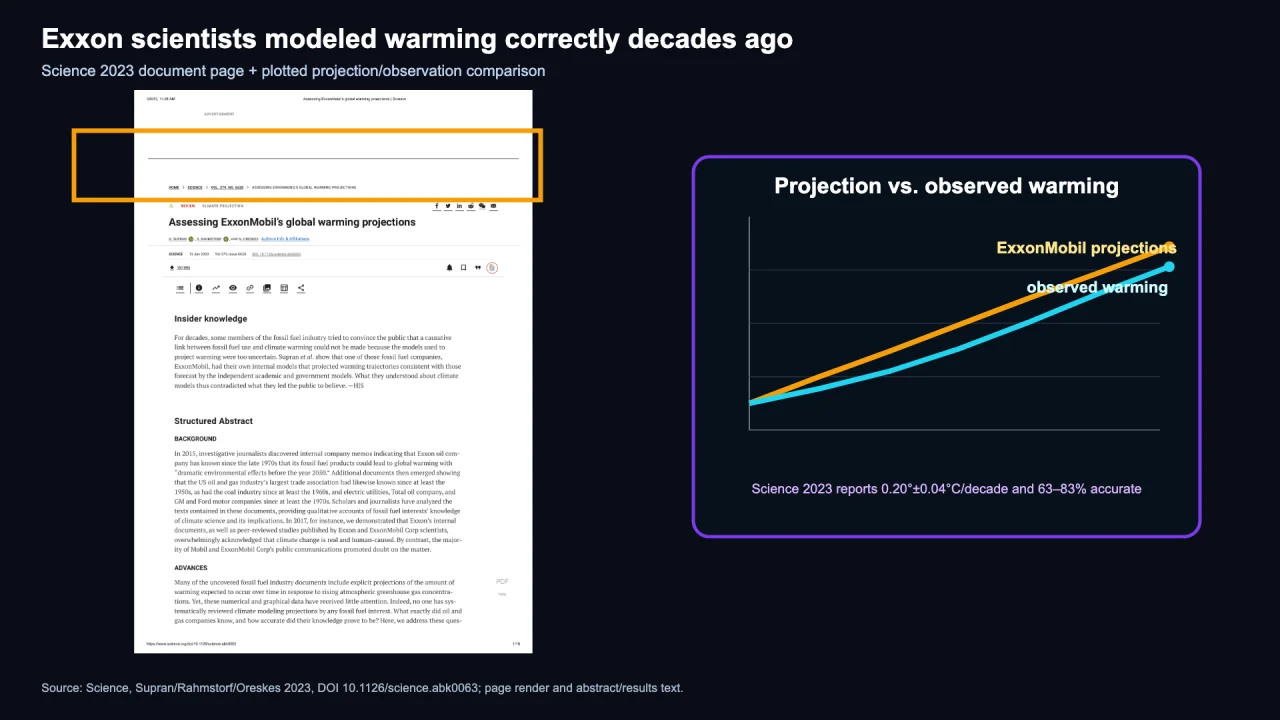
A page from the 2023 Science review beside a chart comparing ExxonMobil's own projections with the warming that was later observed.
The company's private projections, plotted against what actually happened.From the Undastandable film.

The receipt on the doubt side: ExxonMobil's own scientists modeled human-caused warming accurately starting in the late 1970s — a 2023 peer-reviewed review graded their old projections "skillful." Congressional investigators later documented how the company used think tanks and allied groups to publicly muddy the very science it privately got right — about $37 million since 1998, by one watchdog’s count — a strategy borrowed from the tobacco playbook.

The stake on the action side: clean energy is now a huge industry — wind, solar, batteries, electric cars — with its own real interest in faster policy and bigger subsidies, and some of its advocates oversell certainty or pin individual disasters on climate to build momentum.

Naming the money isn't taking a side. It's the fact the shouting leaves out — and it tells you how to read any cost claim: know who profits if you believe it.

The key thing to rememberBoth sides have billions riding on what you believe. Read every claim knowing who benefits.


The Numbers

What's already measured — and where is it heading?

The record so far: 2024 was the warmest year ever measured and 2025 the third-warmest, per Copernicus, Europe's climate monitoring service. Sea level is up about eight inches over the last century, measured by satellites and tide gauges. Greenland has been losing around 280 billion tons of ice a year, Antarctica about 150 billion.

before Paris policies in place today if targets are met 3.6°C 2.6°C 1.9°C Projected warming by 2100. These are ranges, and the range came down.
Projections, not measurements — stated as ranges. Before Paris the projection was about 3.6 degrees; Climate Action Tracker’s November 2025 update puts current policy near 2.6.

The road ahead — stated as ranges, because that's what they are: before the Paris agreement, analysts projected around 3.6 degrees Celsius of warming by 2100. Under policies actually in place today, Climate Action Tracker's November 2025 update projects about 2.6 degrees — and around 1.9 if countries hit their announced targets. Still too high, and genuinely uncertain — but the direction moved, because policy and cheap renewables moved it. Renewables now supply more than thirty percent of the world's electricity.

The key thing to rememberThe measurements are records. The projections are ranges — and the range has come down as the world acted.


The Backfire

Why does the doom version backfire?

A finding that annoys both sides: the panic framing doesn't just overstate the science — it demotivates people. Sander van der Linden, a Cambridge professor who studies persuasion, describes the pattern: some fear spurs action, but too much tips people into avoidance and resignation — if it's hopeless, why try? Climate scientist Friederike Otto says the people she talks to are plenty scared — just not scared into doing anything.

how much people act a little fear helps too much fear shuts people down how frightened people are
The pattern the persuasion researchers describe: a little fear moves people, and past a point it stops them.

Which means the calm version you just read isn't only more accurate. It's more useful.

The key thing to rememberFear past a point produces paralysis, not action — the researchers who study persuasion say so.


Tonight

What can you actually do about it — tonight?

Two moves, both proven, neither requiring panic.

1. Defend your wallet Check the address on your county flood and wildfire hazard map. Shop coverage early. 2. Check one number Open NOAA’s daily Mauna Loa CO2 reading, or Copernicus’ yearly temperature ranking.
Both moves take minutes and neither requires panic.

Defend your own wallet first. The version of climate change most likely to reach you is an insurance bill. Before you buy, renew, or move: check the address's flood and wildfire risk on your county's hazard map, and shop coverage early. That's the cascade from earlier, met at your mailbox — defense you control now.

Check one number yourself. Two minutes: NOAA publishes the daily Mauna Loa CO2 reading; Copernicus publishes the yearly temperature ranking. Open either one. Once you've checked a number with your own eyes, "they say" becomes "I checked" — and a shouting headline from either side has less power over you.

The key thing to rememberCheck your insurance risk, and check one number yourself. Both take minutes.


The Precedent

Has anything this big ever been fixed before?

Yes — and it's the right note to end on. In the 1980s, scientists found that chemicals in refrigerators and spray cans were tearing a hole in the ozone layer. Companies said fixing it would be ruinous. The world signed the Montreal Protocol in 1987 anyway, swapped the chemicals out, and the ozone layer is now measurably healing — on track to recover this century.

1987 2005 today The dark patch is the hole in the ozone layer. It is measurably closing.
The precedent: a sky-sized problem that was measured, argued about, acted on in 1987, and is now healing.

A sky-sized problem, measured, argued, acted on, and fixed — while the doubters said it couldn't be done. Climate is a bigger job. It is not a different kind of job. And because climate moves over decades, there is time to do it deliberately.

The key thing to rememberWe already fixed one sky-sized problem. The playbook exists.


The Threads

Where does this story connect?

Another of our explainers picks up a thread that starts here: the AI data-center land rush (the electricity demand colliding with the grid we're trying to clean).


Sources: every number above — the consensus studies, the Mauna Loa record, the satellite measurements, the temperature rankings, the disaster tally, the insurance figures, the projections — is linked in the source block below, primary sources first, both sides linked where the science is genuinely debated. The organizations: NASA (US space agency, runs Earth-observing satellites), NOAA (US weather and ocean agency, runs Mauna Loa), Copernicus (EU climate monitoring), the IPCC (UN panel that reviews the research), Climate Action Tracker (independent projection analysis), and the 2025 DOE report (the labeled skeptic voice). Don't take our word for anything — that's the whole point.

Don’t take our word for it — all 50 sources, with their links

Primary sources first where there is one. Each link is labeled with what kind of source it is. Live figures (the CO2 reading, the temperature ranking, the renewables share) update, so check the date on the page.

← All explainers